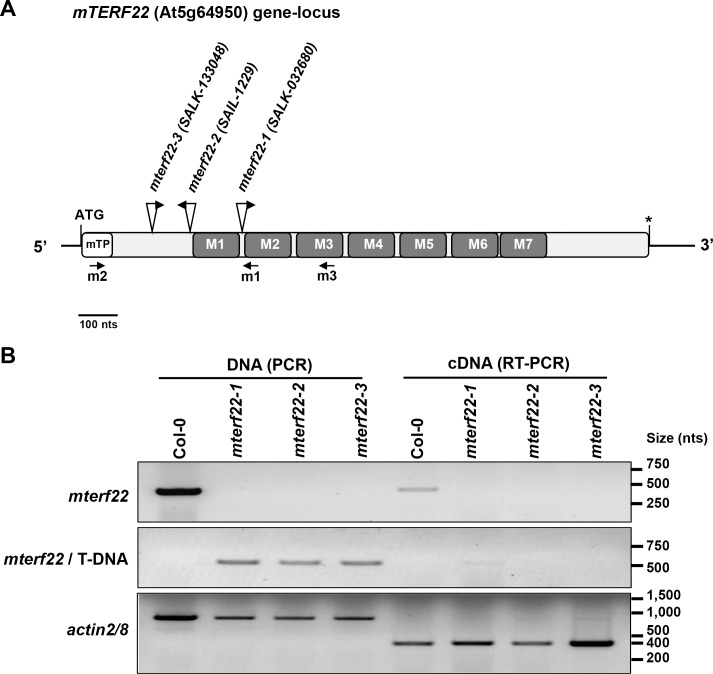
Fig 1. Arabidopsis thaliana (Col-0) mTERF22 structure.
(A) Schematic representation of mTERF22 (At5g64950). The initiation (ATG) site and the stop codon (marked by asterisk) are outlined in the figure. The deduced N-terminal organelle targeting signal (mTP), and the seven MTERF domain are highlighted within the sequence, according to the Conserved Domain Database (CDD) [68] and SMART [69] servers. The locations of the T-DNA insertion sites in mterf22-1 (SALK- 032680), mterf22-2 (SAIL-1229) and mterf22-3 (SALK-133048) are indicated above the sequence (see also S2 Fig). Arrows indicate the positions of the left borders (LBs) in the T-DNA insertional lines. (B) Mutant genotypes were confirmed by PCR with oligonucleotides designed to gene-specific and T-DNA sequences (LBs; about 500 nts upstream or downstream of the T-DNA insertion) (i.e., pROK2 and pCSA110 vectors for SALK and SAIL lines, respectively), followed by sequencing of the ~500 nts PCR products. Specific oligonucleotides are shown below mTERF22 gene scheme (the oligonucleotides m1 for the screening of mterf22-1, m2 for mterf22-2, and m3 for mterf22-3 mutants) and their nucleotides sequences are listed in S1 Table. The relative accumulation of mRNA transcripts corresponding to mTERF22 in wild-type plants (Col-0) and mterf22 mutants was analyzed by RT-PCRs with gene-specific oligos (S1 Table). ACTIN2/8 (At3g18780) was used as a control in the reaction. The bar in panel ‘A’ represents 100 nucleotides.

