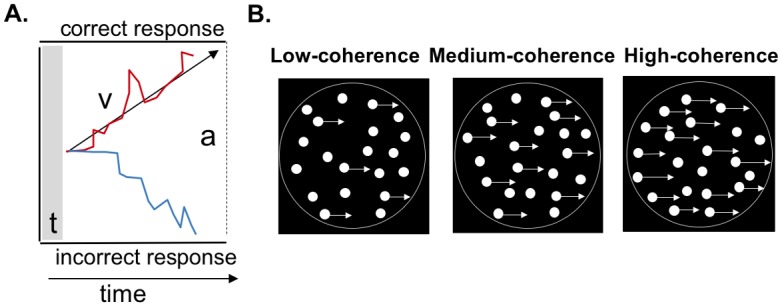
Fig 2.

A: Schematic of the drift diffusion modelling (DDM) framework used to model perceptual decision-making in the dot motion task. In the model, evidence is accumulated over time until a response boundary is crossed. t is the non-decision time, which includes the time taken to execute a motor response. v is the drift rate, which reflects the rate at which sensory evidence is accumulated. This parameter is taken as an index of the quality of sensory information. a represents the boundary separation (correct at the top, incorrect at the bottom), indicating how much information is needed to make a decision. B: Schematic of the random dot-motion task in which participants judged whether signal dots moved on average to the left or right. Task difficulty was titrated by altering the proportion of coherently moving dots (shown with arrows attached, for purposes of illustration) amongst randomly moving dots. In this example the coherent motion is rightward, but in the experiment the dots were equally likely to move toward the left or right. The circles surrounding the dot stimuli are shown here for illustration only, and were not present in the actual displays.
