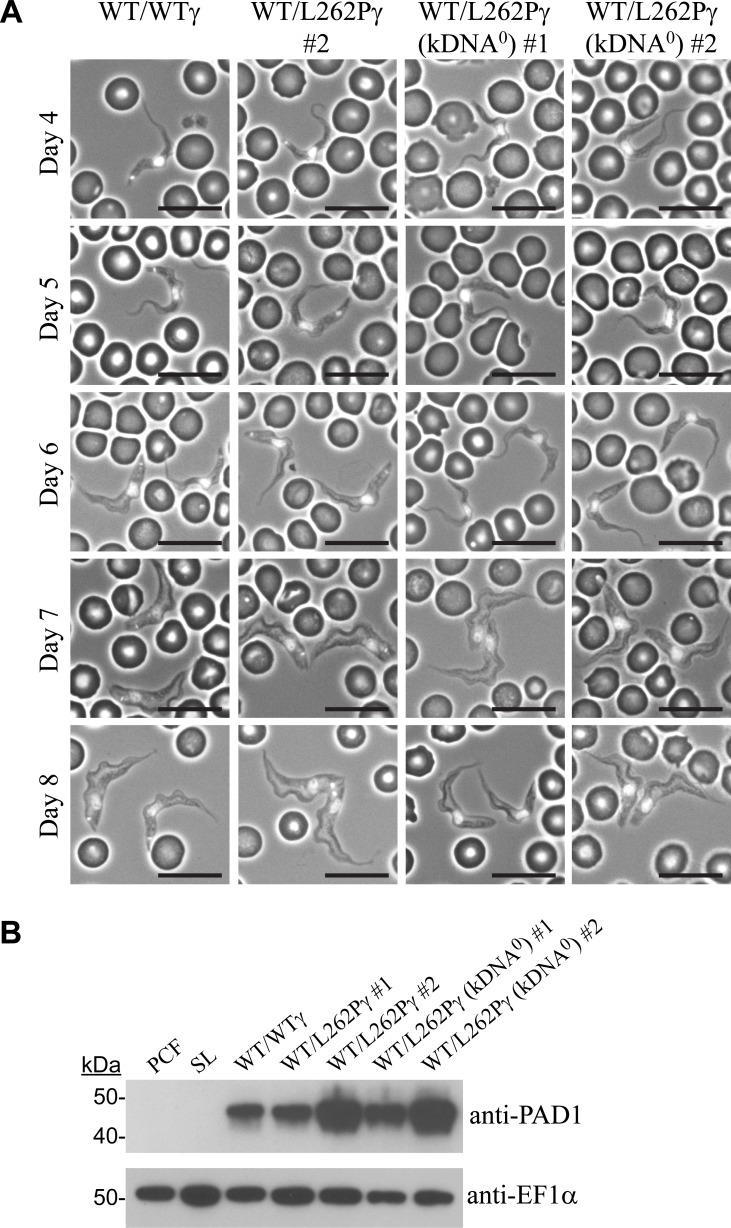
Fig 1. Parasite kDNA is not required for stumpy formation.
(A) Representative phase contrast images showing the morphology of cells at days 4–8 of in vivo infection. Corresponding parasitaemia graphs are shown in Fig 2. Blood smears were taken daily and DAPI-stained, allowing positioning of the nucleus and kDNA to also be assessed. Scale bars represent 10 μm. (B) Immunoblot analysis of expression of the stumpy-specific protein PAD1. Cells were harvested at peak parasitaemia (day 6). 2x10⁶ cells of each cell line were loaded per lane. PCF = procyclic form Lister 427 29.13; SL = slender BSF of parental EATRO 1125 AnTat1.1 90:13 cell line.

