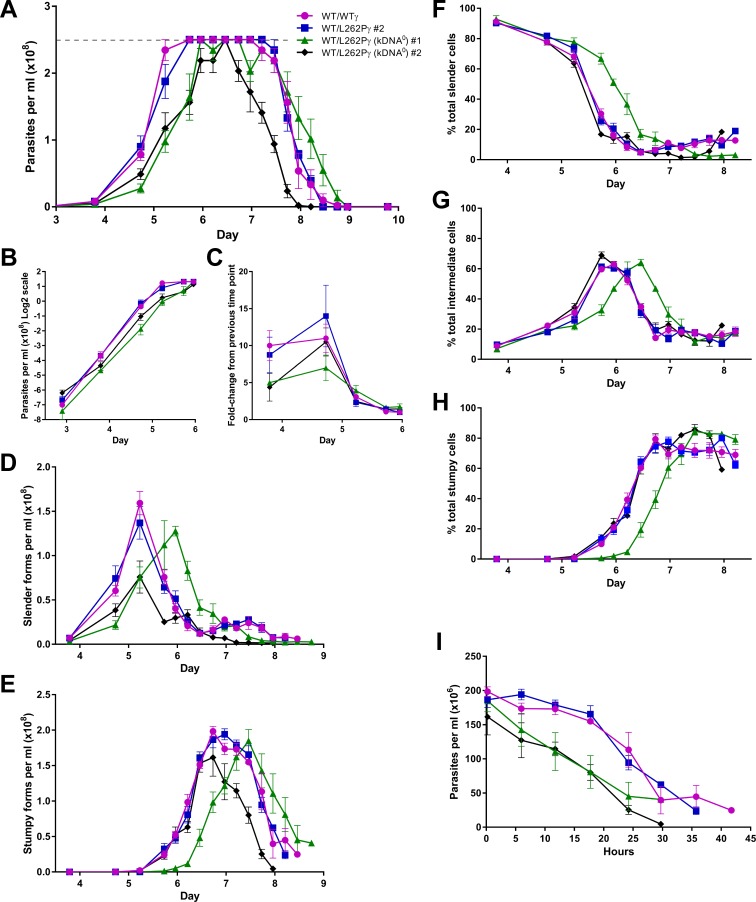
Fig 2. Stumpy forms lacking kDNA persist for a reduced time span during the first peak of parasitaemia.
(A) Parasitaemia during mouse infections was measured over time. Mice were infected at day 0, with four mice infected per cell line. Error bars are standard error of the mean (SEM). Tail snips were performed every 6 h from day 4 to day 10 post infection and cell counts were estimated from blood smears. Dashed grey line indicates accurate detection limit via the Rapid Matching method. (B) Data from panel A (up to day 6) plotted on a semi-log scale. (C) Fold-change in parasitaemia between time points (up to day 6). (D-H) The morphological changes occurring during these mouse infections, expressed as cell densities (D, slender forms; E, stumpy forms) or percentages (F, slender cells; G, intermediate cells; H, stumpy cells). Error bars are SEM. The population of cells were scored as having slender, intermediate or stumpy form morphology from DAPI-stained dry blood smears. (I) The levels of parasitaemia of stumpy forms per ml of blood, where t = 0 is the time point where the stumpy number was highest for each cell line. This time point was 6 days and 16 hours for cell lines WT/WTγ, WT/L262Pγ #2 and WT/L262Pγ (kDNA0) #2, and 7 days and 12 hours for WT/L262Pγ (kDNA0) #1. Error bars are SEM.

