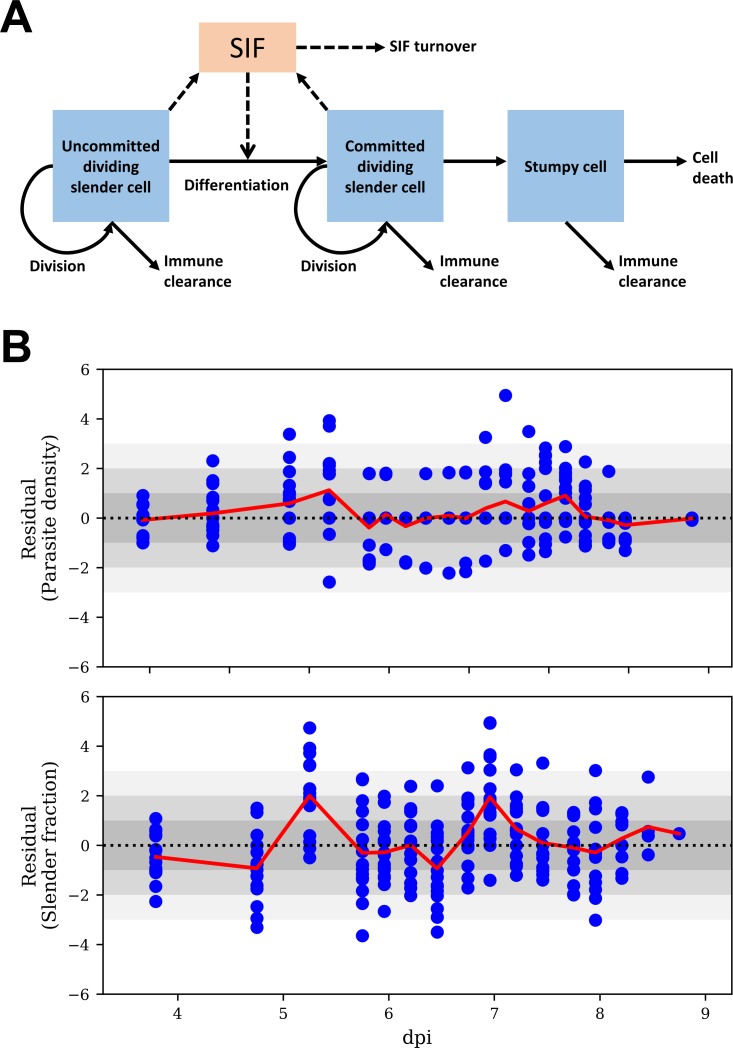
Fig 4. The mathematical model for T. brucei infection dynamics.
(A) Schematic of the mathematical model. Slender cells can become committed to differentiation via a SIF dependent route, proportional to SIF concentration, and a SIF independent route. SIF is produced by both committed and non-committed slender forms, and is cleared over time. The concentration of each cell type depends on the replication rate (applicable to slender forms only), the immune clearance rate, the lifespan of that cell type and the differentiation rate (applicable to slender forms only). (B) Standardised residuals (blue circles) of parasite density and slender fraction, by time (dpi, days post infection), of the model fits with SIF-dependent and -independent differentiation to all mice. Under a true model standardised residuals have an approximately standard normal distribution (i.e., zero mean and unit standard deviation (SD)). Inadequate fit of a model is indicated by its residuals deviating from a standard normal distribution (such as residuals further than ~3 SD from zero, represented by the lightest grey shading, or a set of residuals consistently above or below zero. The red line shows the average, across all mice, of the residuals at a particular time point.

