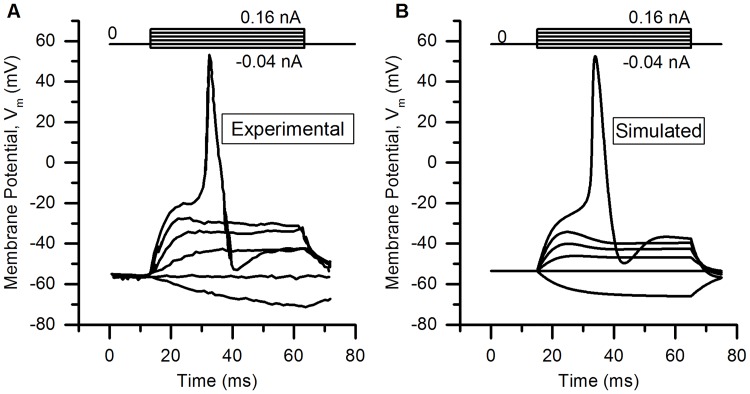
Fig 10. Comparison of experimental and simulated subthreshold potentials in bladder small DRG neuron soma model.
(A) Experimental changes in Vm generated by applying 50 ms rectangular current clamps of amplitudes ranging between −0.04 nA to 0.16 nA in steps of 0.04 nA as shown in (data from [36]). (B) Response of the model for similar stimuli. Note: one AP is shown in each panel above the subthreshold responses for the sake of comparison.

