
Fig. 4.
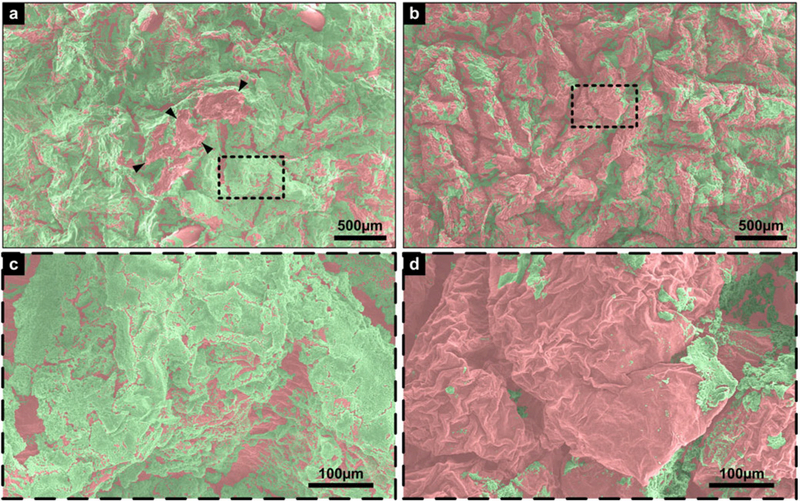
False-colored SEM images: (a) Positive control composite image with FOV of 3.756 mm by 2.347 mm, damaged area demarcated by arrowheads, (b) shockwave treated sample composite image, with same FOV as (a), (c) magnified image of boxed area in (a), with a FOV of 0.601 mm by 0.376 mm, and (d) magnified image of boxed area in (b), same FOV as (c). Green represents biofilm, red represents pigskin. Scale bar for (a) and (b) is 500 μm; scale bar for (c) and (d) is 100 μm.