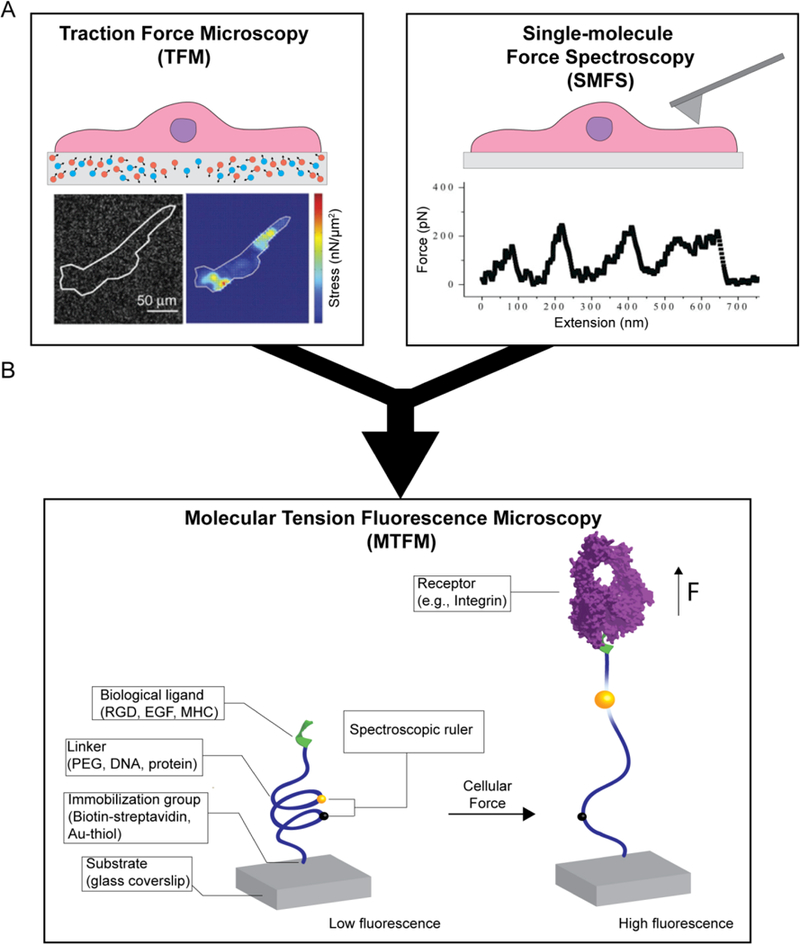
Figure 2. Schematic of current technologies to image cell forces.

(A) Scheme depicting traction force microscopy (TFM) and single-molecule force spectroscopy (SMFS). Adapted with permission from ref 19. Copyright (2016) Nature Publishing Group, and ref 20. Copyright (2003) Elsevier. (B) Simplified diagram that shows how tension probes report on cell forces.
