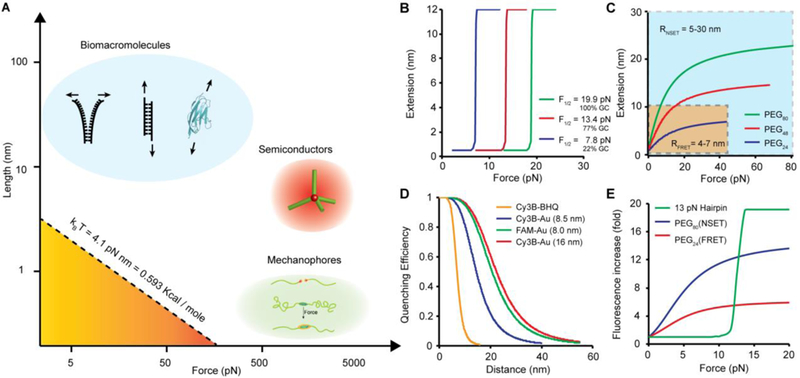
Figure 3. Force-extension relation for different molecular force probes.

(A) Plot showing the force-extension relationship of biomolecules [blue: DNA duplex and titin immunoglobulin I27 domain (PDB ID: 1TIT)] used in MTFM; semiconductor tetrapod (red) and mechanophores (green). The dashed line corresponds to the mechanical work (product of force multiplied by deformation distance) that is equivalent to thermal energy (kBT, at room temperature). The stability of tension probes is greater than kBT and tuned to probe different processes. (B) Plot showing the expected force-extension curve for DNA hairpins of different GC contents at 25°C. The plots were generated using eq. 2 which describes the unfolding probabilities of DNA as a function of applied forces. (C) Theoretical plot showing the force responses of PEG linkers as a function of PEG length distance. The yellow region highlights the range of extensions that can be detected by fluorescence resonance energy transfer (FRET), while the blue region highlights the range of distances probed by nanometal surface energy transfer (NSET). (D) Plot showing the NSET quenching efficiency as a function of PEG extension with different energy transfer mechanisms (parenthesis indicates the radius of AuNP). Experimental data re-plotted from ref 39 (E) Plot comparing the fold increase of donor fluorescence as a function of tension applied to different probes.
