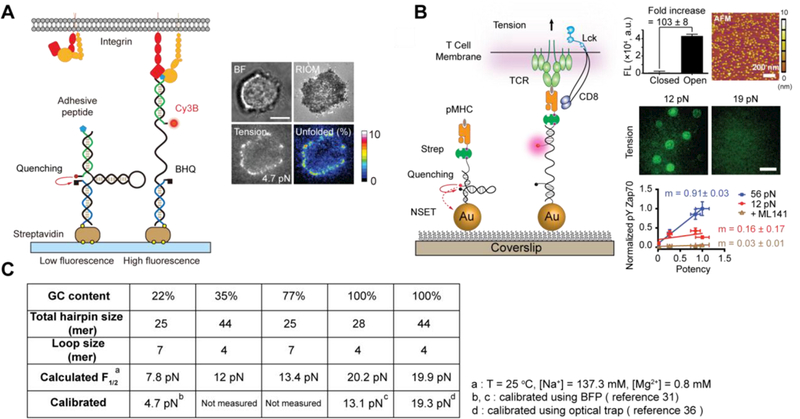
Figure 5.

(A) Schematic of the DNA-based tension sensor, which is comprised of an anchor strand immobilized onto a surface (blue), a hairpin strand that unfolds under sufficient tension (black) and a ligand strand presenting an adhesive peptide (green). At the apposing termini of the ligand and anchoring strands, a fluorophore and quencher were coupled to report the force-induced unfolding of the hairpin (left). Table summarizes the calculated and measured F1/2 values, GC content and the calculated free energy of hybridization of all hairpins used (top right). Representative brightfield, RICM and tension (4.7 pN) images show the initial stage of cell spreading and adhesion (bottom right). Adapted with permission from ref 31. Copyright 2014 Nature publishing group. (B) Schematic of DNA-based AuNP sensor for mapping TCR-mediated tension. The fluorescence of the Cy3B dye (pink dot) is dequenched upon mechanical unfolding of the hairpin, which separates the dye from the black hole quencher 2 (BHQ2, block dot) and AuNP surface (left). Plot shows a 103 ± 8-fold increase in fluorescence on the opening of hairpins and AFM image shows the immobilized AuNP sensors on a glass coverslip (top right). Representative tension images of OT-1 cells cultured on tension probe surfaces modified with N4 pMHC show differential force response on 12 and 19 pN probes (middle right). Plot of pYZap70 levels in response to ligands with increasing potency under physical or chemical perturbations. The slope (m) indicates the T-cell specificity to different ligands (bottom right). Adapted with permission from ref 9. Copyright 2016 National Academy of Sciences, USA. (C) Table showing a list of DNA hairpin probes used for tension sensing.
