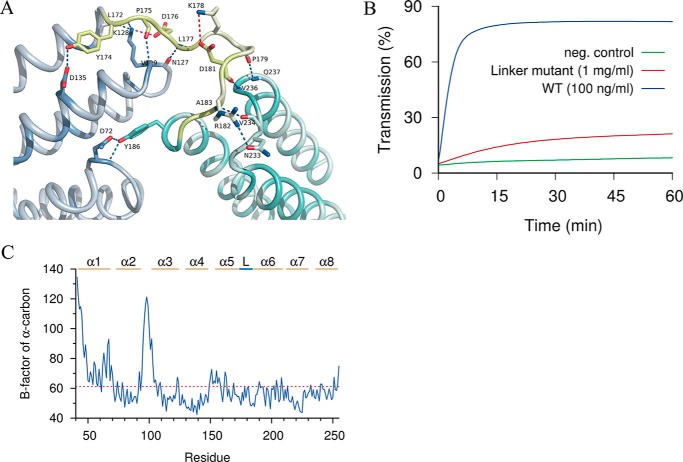
Figure 6.
Structural details of conserved linker region. A, hydrogen bonds (blue dotted lines) and ionic bonds (red dotted lines) between residues within the linker region (lime) as well as adjacent residues in the NTD (blue-gray) and CTD (blue-green) are shown. B, mutation of the conserved linker region abolished the hemolytic activity of intact CAMP. C, B-factor analysis of the conserved linker region revealed low flexibility. The B-factors of the α-carbons of all residues of the A chain are shown. Helical segments are indicated as α1–α8. L, the linker region between the N-terminal and C-terminal domains.

