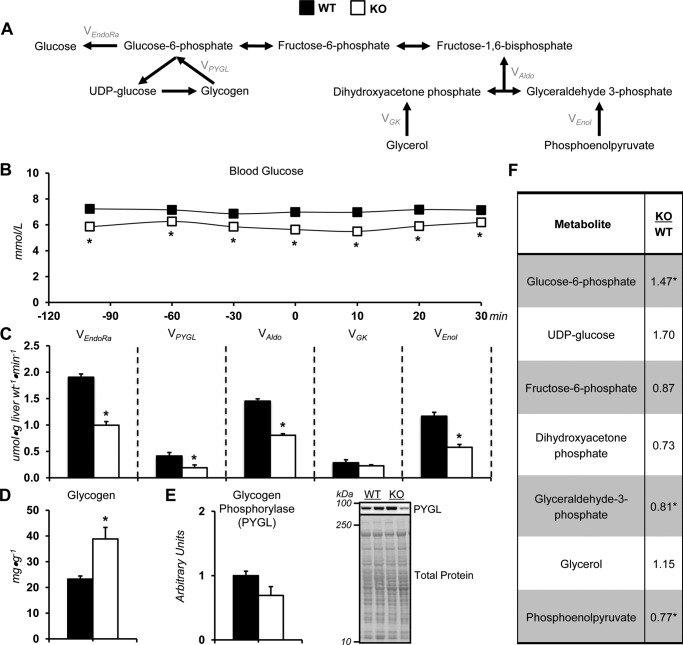
Figure 2.
Altered glucose producing fluxes in glycine N-methyltransferase knockout mice. A, schematic representation of select metabolites and fluxes (highlighted in gray) from 2H/13C metabolic flux analysis contributing to endogenous glucose production. B, a time course of fasting arterial blood glucose concentration before and during acquisition of plasma for 2H/13C metabolic flux analysis in WT and glycine N-methyltransferase KO mice. C, model-estimated, absolute nutrient fluxes normalized to liver weight (μmol·g liver weight−1·min−1) in mice for endogenous glucose production (VEndoRa), flux from glycogen to glucose 6-phosphate (VPYGL), flux from dihydroxyacetone phosphate and glyceraldehyde 3-phosphate (VAldo), flux from glycerol to dihydroxyacetone phosphate (VGK; hexose units), and flux from phosphoenolpyruvate to glyceraldehyde-3-phosphate (VEnol; hexose units). D, liver glycogen concentration. E, liver PYGL as determined by immunoblotting and representative immunoblot. F, glycogen- and gluconeogenesis-related metabolites: glucose 6-phosphate (G6P), UDP-glucose, fructose 6-phosphate (F6P), dihydroxyacetone phosphate (DHAP), glyceraldehyde 3-phosphate (GAP), glycerol, and phosphoenolpyruvate (PEP). Data are mean ± S.E. (error bars). n = 6–11 mice/group. *, p < 0.05 versus WT.

