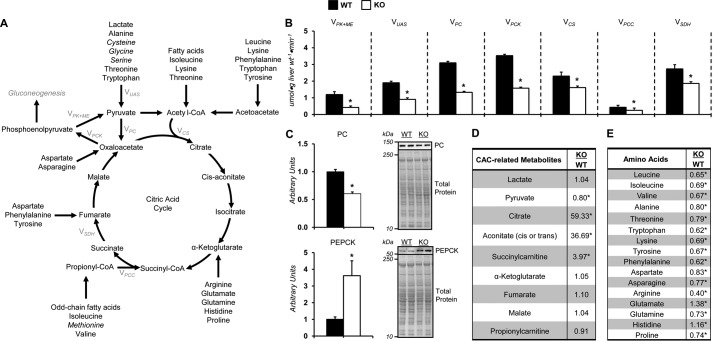
Figure 3.
Impaired citric acid cycle–related fluxes in vivo in glycine N-methyltransferase knockout mice. A, schematic representation of select enzymes, metabolites, and fluxes (highlighted in gray) from 2H/13C metabolic flux analysis associated with citric acid cycle metabolism, anaplerosis, and cataplerosis. Italicized metabolites are intimately associated with SAM homeostasis and are provided in other figures. B, model-estimated, absolute nutrient fluxes normalized to liver weight (μmol·g liver weight−1·min−1) in post-absorptive glycine N-methyltransferase KO and WT mice for contribution of pyruvate kinase and malic enzyme to pyruvate (VPK+ME), flux from nonphosphoenolpyruvate-derived, unlabeled anaplerotic substrate to pyruvate (VUAS), anaplerotic flux as modeled by pyruvate to oxaloacetate (VPC), cataplerotic flux modeled as oxaloacetate to phosphoenolpyruvate (VPCK), flux from oxaloacetate and acetyl-CoA to citrate (VCS), anaplerotic flux as modeled by propionyl-CoA to succinyl-CoA (VPCC), and flux from succinyl-CoA to oxaloacetate (VSDH). C, liver cytosolic PEPCK and PC as determined by immunoblotting and representative immunoblot. The total protein loading control image for PC is the same as that used for PYGL in Fig. 2E, given that the immunoblots were performed on the same PVDF membrane. D, liver CAC and related metabolites: lactate, pyruvate, citrate, aconitate, succinylcarnitine, α-ketoglutarate, fumarate, malate, and propionylcarnitine. E, hepatic amino acids: leucine, isoleucine, valine, alanine, threonine, tryptophan, lysine, tyrosine, phenylalanine, aspartate, asparagine, arginine, glutamate, glutamine, histidine, and proline. Data are mean ± S.E. (error bars). n = 6–11 mice/group. *, p < 0.05 versus WT.

