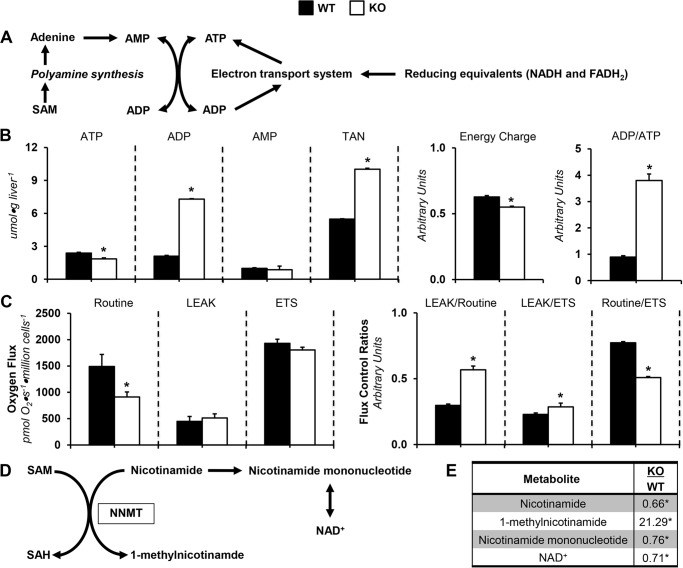
Figure 4.
Dysregulated energy metabolism in glycine N-methyltransferase knockout mice. A, schematic representation of select metabolites and pathways related to energy homeostasis. B, hepatic adenine purine nucleotides ATP, ADP, AMP, and TAN pool (TAN = ATP + ADP + AMP) from glycine N-methyltransferase KO and WT mice. Energy state indexes energy charge ([ATP + 0.5·ADP]/[TAN]) and ADP/ATP. C, isolated, intact hepatocyte respiratory states (routine, LEAK, and electron transport system) and flux control ratios: LEAK/routine (L/R), LEAK/electron transport system (L/E), and routine/electron transport system (R/E). D, schematic representation of select metabolites associated with NNMT-mediated transmethylation. E, NNMT-related metabolites: nicotinamide, 1-methylnicotinamide, nicotinamide mononucleotide, and NAD+. Data are mean ± S.E. (error bars). n = 6–9 mice/group. *, p < 0.05 versus WT.

