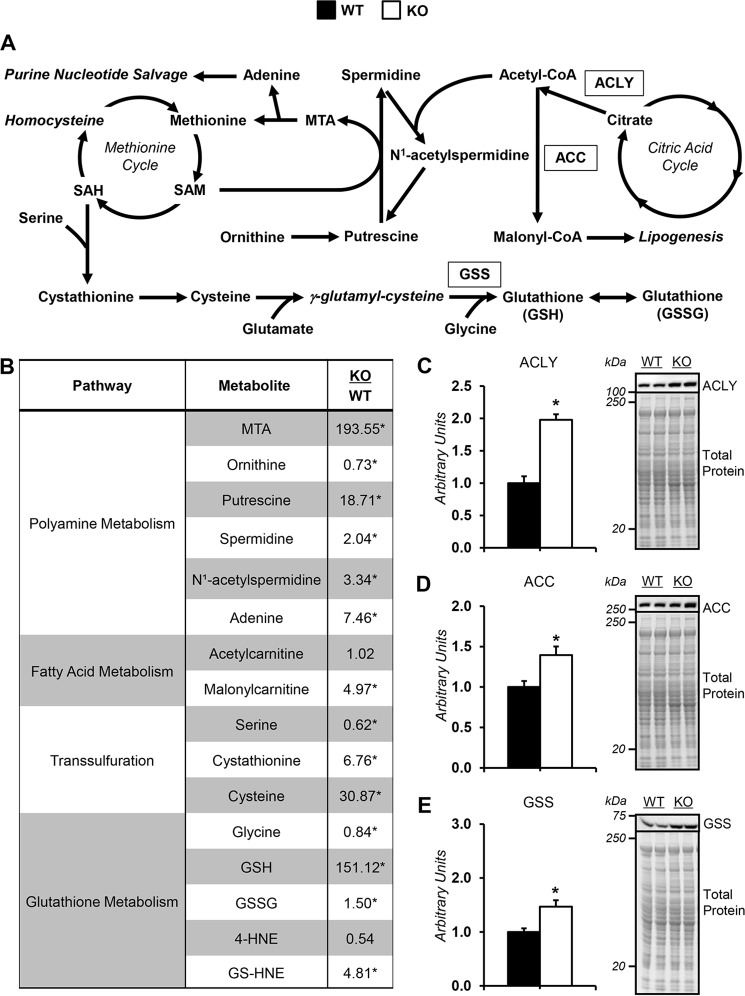
Figure 5.
Alterations in liver SAM-consuming pathways in glycine N-methyltransferase knockout mice. A, schematic representation of select enzymes, metabolites, and pathways related to SAM homeostasis. B, liver metabolites related to SAM metabolism in glycine N-methyltransferase KO and WT mice: MTA, adenine, ornithine, putrescine, spermidine, N1-acetylspermidine, acetylcarnitine, malonylcarnitine, serine, cystathionine, cysteine, glycine, GSH, GSSG, 4-hydroxy-2-nonenal (4-HNE), and 4-hydroxy-nonenal-GSH (GS-HNE). C–E, ACLY (C), ACC (D), and GSH synthetase (GSS) (E), as determined by immunoblotting and representative immunoblot. The total protein loading control image for ACLY is the same as that used for ACC, given that the immunoblots were performed on the same PVDF membrane. Data are mean ± S.E. (error bars). n = 6–9 mice/group. *, p < 0.05 versus WT.

