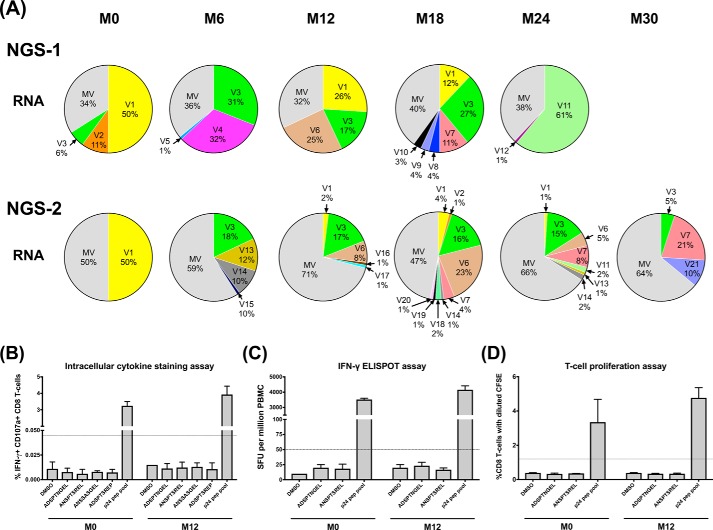
Figure 4.
p6 pol peptide-specific CD8 T-cell immune responses in subject T004. A, each pie chart represents the profile of the p6 pol variant viral forms at a specific time point. Each slice in a pie chart represents a specific variant at a prevalence of 1% or above of the total reads. All the viral variant forms present below 1% prevalence were pooled as the minority variants (MV). NGS-1 and NGS-2 analyses performed using the plasma viral RNA are presented. See Table S2 for the sequences of the major variant viral forms. B, frequency of antigen-specific CD8 T-cell subsets double-positive for IFN-γ secretion and CD107a degranulation as measured using the ICS assay. Stored PBMCs derived from time points M0 and M12 were used in all the three immune assays. C, number of IFN-γ spot-forming units measured using the ELISPOT assay. D, percentage of CD8 T-cells showing a diluted CFSE staining. The dotted lines indicate the cutoff value defined as three times the mean value of the DMSO control. The error bars represent the standard deviation from the mean of responses from three assay replicates.

