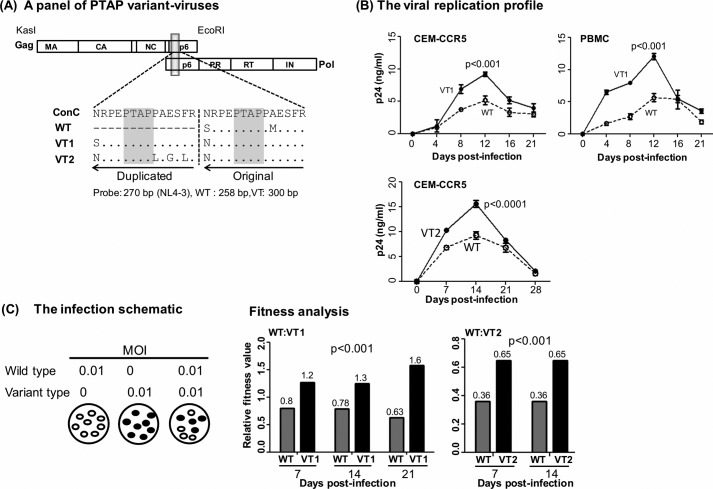
Figure 5.
Replication profile of the single- and double-PTAP viral molecular strains of the Indie-C1 molecular clone. A, panel of three PTAP-variant viral strains. WT lacks PTAP duplication. The PTAP sequences of VT1 and VT2 represent the dominant NGS forms of T004 RNA at M0 (see Fig. S1). The viral strains of the panel are genetically identical except for the differences shown in the PTAP motifs. Both the PTAP motif sequences are compared with the HIV-1C consensus sequence in the sequence alignment. The dashes represent sequence deletion, and dots represent sequence identity. B, replication profile of VT1 (top panels, CEM-CCR5 T-cells or CD8-depleted and activated PBMC of a healthy subject) and VT2 (bottom panel, CEM-CCR5 T-cells) strains was compared with that of WT. The cells were infected with 100 TCID50 units of single- or double-PTAP viral strain in duplicate wells, and the secretion of p24 into the medium was monitored up to 21–28 days. The data are presented as the mean of quadruplicate wells ± S.D. and representative of two independent experiments. A two-way ANOVA test was performed to determine the significance of the difference in proliferation between the viral strains. Comparable results were obtained with the PBMC of several other healthy donors. C, pairwise growth competition between single- and double-PTAP viral strains in HTA. The left panel shows the schematic representation of the ratios of the paired viruses used in the assay. Genomic DNA was extracted from the infected cells every week following infection and used in the assay as described under “Materials and methods.” The relative fitness values (depicted above the bars) of the competing viral strains WT versus VT1 (middle panel, days 7, 14, and 21) and WT versus VT2 (right panel, days 7 and 14) in CEM-CCR5 cells are presented. A two-way ANOVA test was performed to determine the statistical significance. Data are representative of two independent experiments.

