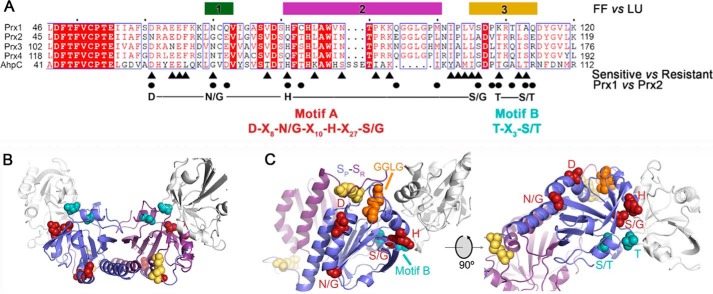
Figure 3.
Structure and sequence comparisons identify resistance motifs. A, summary of the structural and sequence information that led to the identification of resistance motifs A and B. The bars for regions 1–3 indicate the largest structural changes between the reduced (FF) and oxidized (LU) conformations (see Fig. 2 and Fig. S2). The triangles below the alignment highlight the residues, identified by WebLogo analysis, that differ between sensitive and resistant Prxs (Fig. S3 and Table S2). The circles indicate the residue differences in regions 1–3 for Prx1 and Prx2. The putative resistance motifs A and B are highlighted in red and cyan, respectively. The same coloring scheme for the residues within these motifs is used in the subsequent panels. B, location of motifs A and B in the Prx toroid context (see Fig. 2D for entire toroid). Both the Cys-SP and Cys-SR residues involved in disulfide bonds are colored yellow for the central Prx dimer. One subunit for each of the two adjacent dimers is shown in white. Motif A is predominantly located on the exterior of the toroid. Motif B lines the interior of the toroid. C, proximity of resistance motifs A and B to the Cys-SP residue, the GGLG motif, and the dimer-dimer interface.

