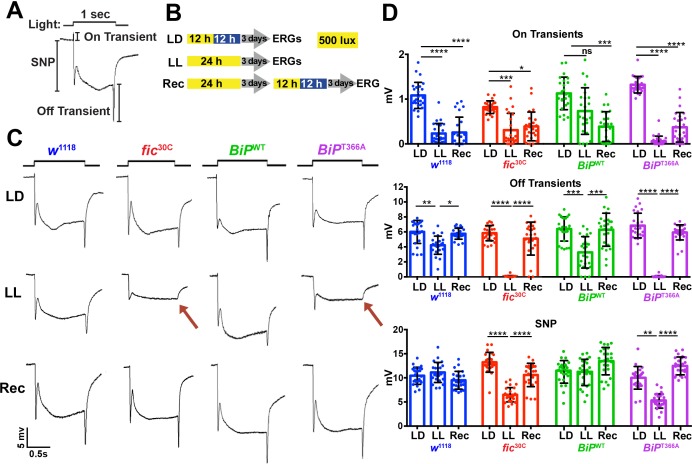
Figure 3. Fic-mediated AMPylation of BiP is required for photoreceptor maintenance.
(A) A representative ERG trace in response to a 1 s light pulse displaying the sustained negative potential (SNP), representing the depolarization within photoreceptor neurons, and the ON and OFF transients, reflecting post-synaptic activity of lamina neurons. (B) Representation of the different light treatments of flies before ERG recordings: 3 days of 12 hr light (500 lux) and 12 hr dark (LD), 3 days of continuous light (LL) or 3 days of continuous light followed by 3 days of LD (Rec). 1 s light pulses were performed at 4 s intervals. (C) Representative traces from w1118, fic30C, BiPWT and BiPT366A flies. Under LL, fic30C and BiPT366A mutants lose ON and OFF transients (red arrows) and have reduced SNPs. The changes are reversed after 3 days of recovery (Rec). (D) Quantification of key components of ERGs shown in panel C. Bar graphs show means ± SD. ****p<0.0001; ***p<0.001; **p<0.01; *p<0.05; n = 24 flies for each genotype/condition, pooled from three independent biological replicas.


