. 2018 Jul 19;7:e38389. doi: 10.7554/eLife.38389

Figure 2. Verification of expression data by Northern blotting.

(Left panels) RNA samples from staged embryos were resolved by 15% denaturing PAGE and probed for the mature species of the indicated miRNA gene. Mature miRNA and precursor species are indicated by lines and asterisks respectively. (Right panels) Mature miRNA quantification using small RNA library data. Average values of triplicates are shown. Error bars indicate the standard error of mean.

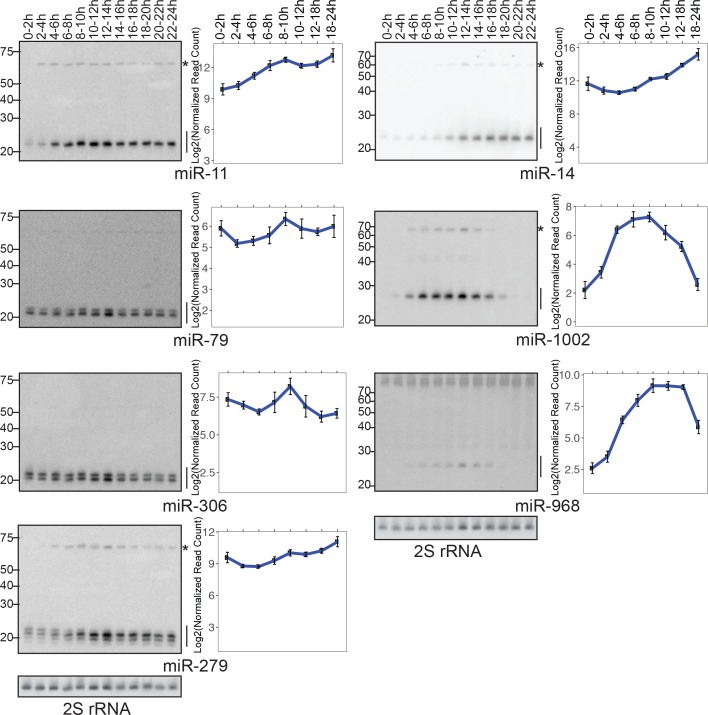
Figure 2.

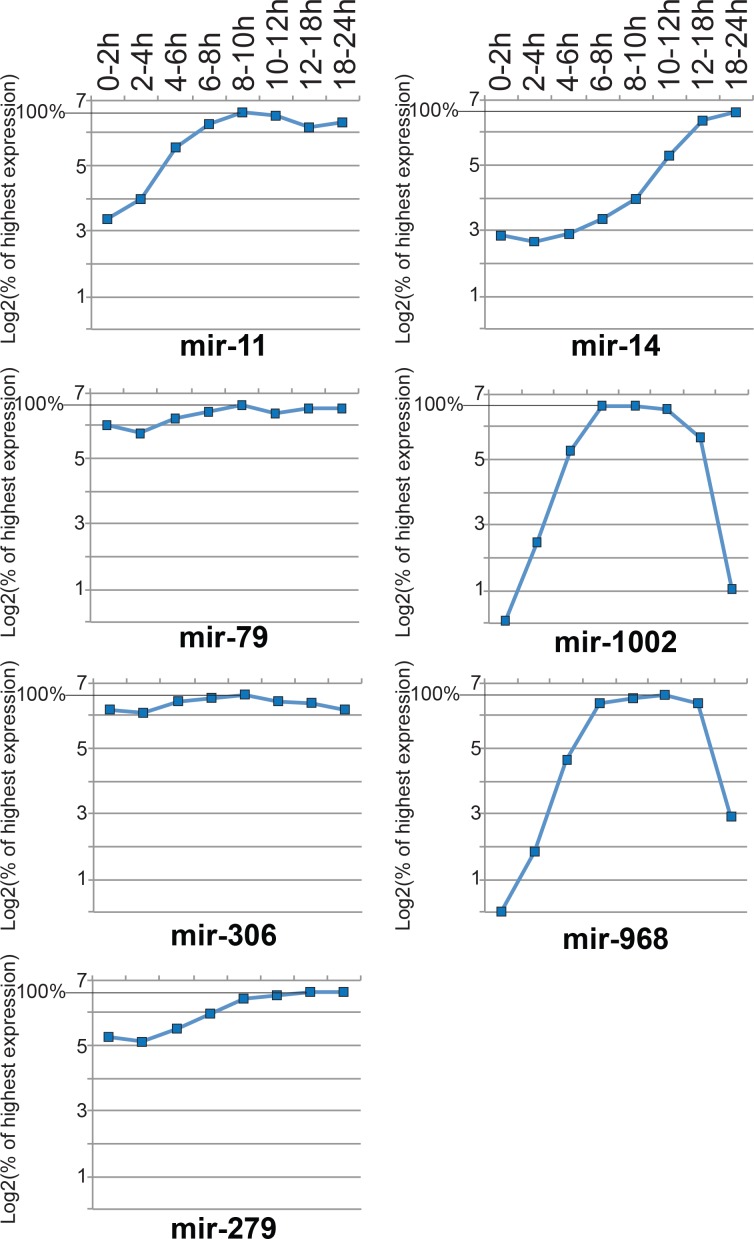
Figure 2—figure supplement 1. Quantification of Figure 2 Northern blotting results.

Figure 2—figure supplement 1.

Mature miRNA signals were quantified and normalized by the 2S rRNA signal in the corresponding lane. The expression values were further normalized by the signal from the time window where the highest expression level of the miRNA was seen, and expressed as a percentage. The y-axes show log2 of the normalized expression values.