. 2018 Jul 19;7:e38389. doi: 10.7554/eLife.38389

Figure 5. Distinct miRNA subsets are produced from the mir-317 cluster by alternative pri-miRNA isoforms.

(A) UCSC genome browser snapshot of the mir-317 cluster locus. Small RNA-seq (upper) and total RNA-seq (lower) data are shown. In embryos (blue) miR-277 expression is higher than the other two miRNAs, and even higher in late embryos, which is consistent with the high expression of pri-miRNA isoform starting from TSS3 in embryos. In testes and ovaries, long isoforms starting from TSS1 and 2 are dominant, and the miR-277 level is lower than miR-317 and miR-34. In all tissues and embryonic stages, the ratios between miR-317 and miR-34 remain similar. (B) Reanalysis of published total RNA-seq data from cultured cells treated with ecdysone. The sum of FPKMs of the isoforms sharing the same TSS was plotted. (C) Northern blotting analysis of mature miR-317,–277 and −34 levels after 20-HE (hydroxyecdysone) addition in Kc167, S2-R+ and BG3-c2 cells. Cells were treated with 20-HE for the indicated time and total RNA was separated on a 15% denaturing acrylamide gel. miR-317 and miR-34 were decreased after 20-HE addition in Kc167 and S2-R+ cells, while the decrease of miR-277 was much weaker in these cell lines. In contrast, miR-277 was also decreased in BG3-c2 cells, in which the level of the mir-277 specific short isoform was very low even in the absence of 20-HE (Panel B, TSS3). See Figure 5—figure supplement 3for the quantified results of tripricates.

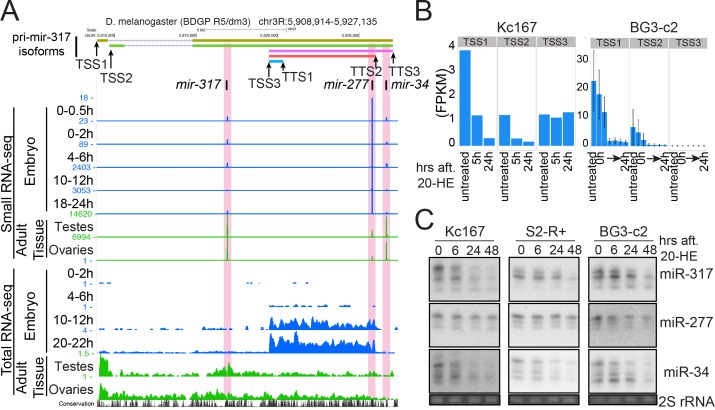
Figure 5.

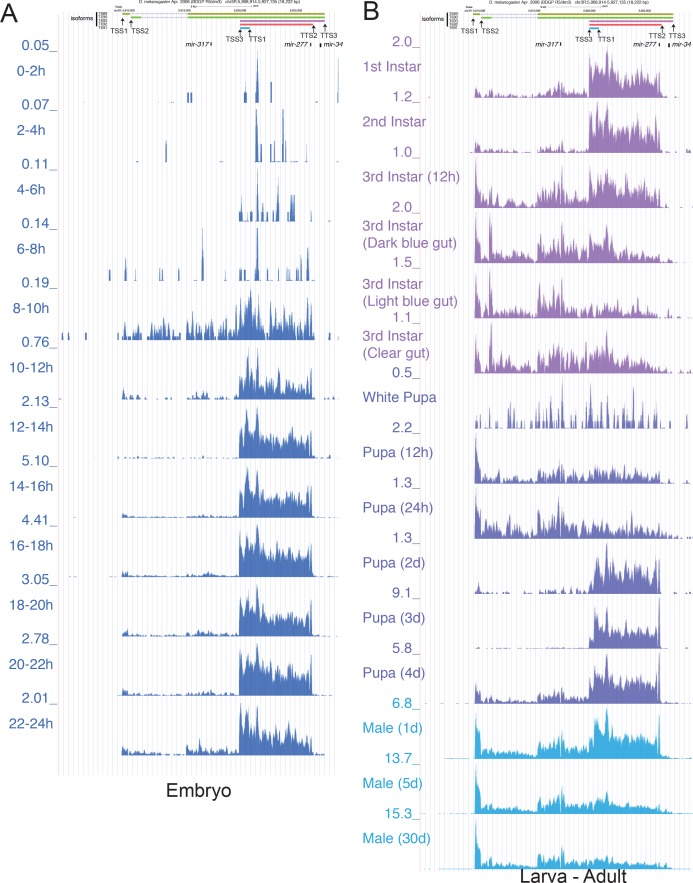
Figure 5—figure supplement 1. UCSC Genome Browser screen shot of the mir-317 cluster locus with total RNA-seq tracks.

Figure 5—figure supplement 1.

(A) Total RNA-seq data from staged embryos show that the short pri-mir-317 isoform starting from TSS3 is the dominant isoform in embryos with an expression peak at 14-18hAEL. (B) Total RNA-seq data from post-embryonic stages show dynamic changes in pri-mir-317 isoform selection.
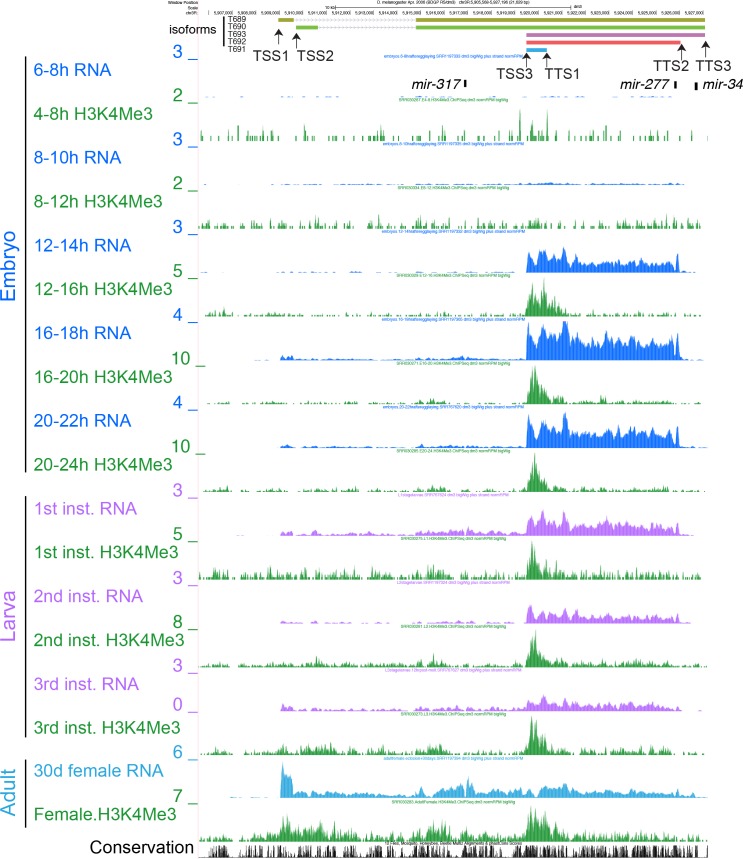
Figure 5—figure supplement 2. UCSC Genome Browser screenshot of the mir-317 cluster locus with total RNA-seq and Histone H3K4me3-ChIP tracks.

Figure 5—figure supplement 2.

Total RNA-seq tracks are color coded by the developmental stage (Blue: embryo, Purple: larva, Light blue: adult). Green tracks are ChIP-seq tracks for H3K4me3, which is enriched at active chromatin regions (modENCODE Consortium et al., 2010). H3K4me3 peaks were seen near the TSS3 in late embryos, and additional H3K4me3 peaks appeared near TSS1/2 sites in adults, supporting the alternative usage of the TSSs identified by the RNA-seq analysis.
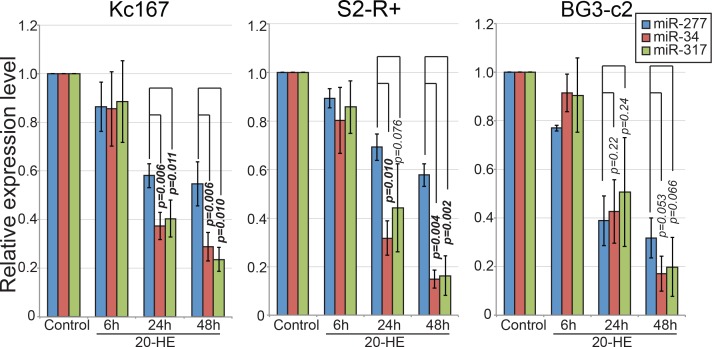
Figure 5—figure supplement 3. Quantification of the Northern blotting results shown in Figure 4C and their biological replicates.

Figure 5—figure supplement 3.

Kc167, S2-R+ and BG3-c2 cells were treated with 20-HE for the indicated time and total RNA was separated on a 15% denaturing acrylamide gel. The mature signals were quantified and normalized for 2S rRNA signals. The normalized values from three replicates were plotted (Average ± standard deviation). Student’s t-test p-values are shown. P-values less than 0.05 are shown in bold letters. Raw data can be found in Figure 5—figure supplement 3—source data 1.
Figure 5—figure supplement 3—source data 1. Raw data for Figure 5—figure supplement 3—source data 1.
Individual values for the replicates (Sheet 1: Raw value), and averages and standard deviations (Sheet 2: Summary) are reported. For the charts, values on the summary sheet were used. T-test p-values are reported on the raw value sheet.
DOI: 10.7554/eLife.38389.018