. 2018 Feb 5;126(2):027003. doi: 10.1289/EHP2311

Figure 1.

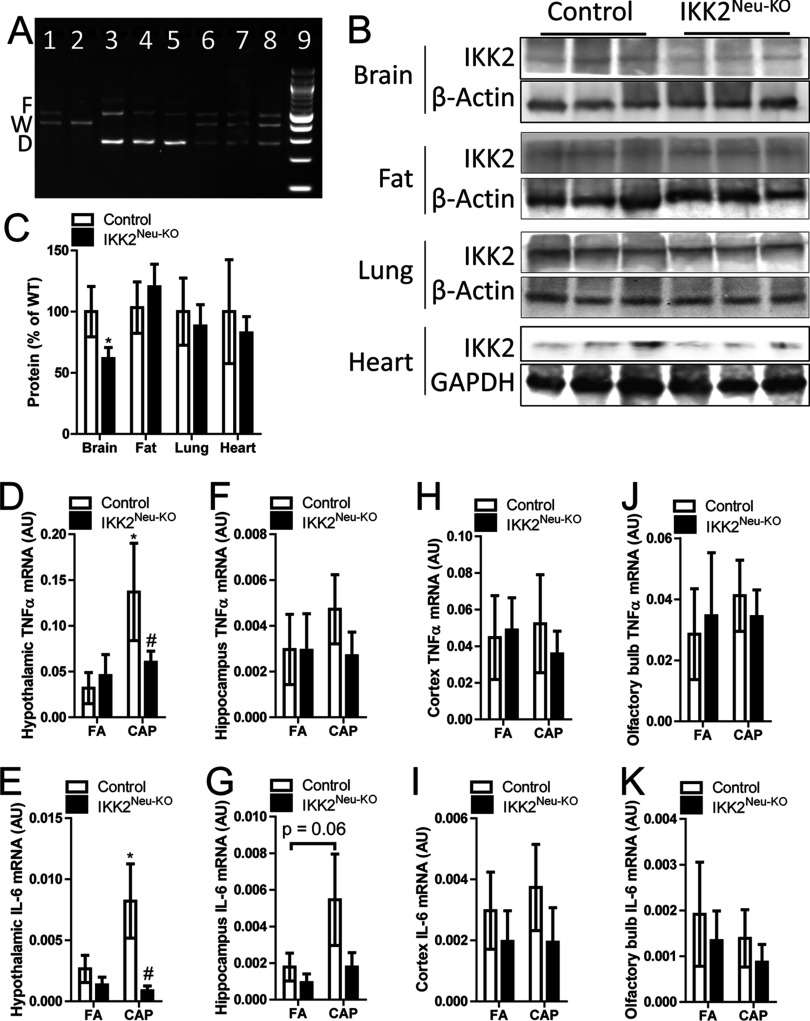
Figure 1A is a PCR assay. Figure 1B is a Western blot showing the protein expression in brain, fat, lung, and heart tissues from male control mice and IKK2 super Neu KO mice. Figure 1C is a stacked bar graph with standard deviation plotting protein expression (percentage of WT) (y-axis) in brain, fat, lung, and heart tissues (x-axis) from male control mice and IKK2 super Neu KO mice. Figures 1D to 1K are stacked bar graphs with standard deviation plotting hypothalamic TNF alpha mRNA (AU), hypothalamic IL 6 mRNA (AU), hippocampus TNF alpha mRNA (AU), hippocampus IL 6 mRNA (AU), cortex TNF alpha mRNA (AU), cortex IL 6 mRNA (AU), olfactory TNF alpha mRNA (AU), and olfactory IL 6 mRNA (AU), respectively (y-axis), from male control mice and IKK2 super Neu KO mice as exposed to CAP and FA (x-axis).

Tissue-specific IKK2 expression and brain region–specific higher tumor necrosis factor-α (TNFα) and interleukin (IL)-6 mRNA expression. (A) Polymerase chain reaction (PCR) assay of flox allele (F), wild-type allele (W), and deletion allele (D) according to genotype in 13-wk-old male mice. Lane 1: IKK2flox/+; Lane 2, Nestin-creIKK2+/+; Lanes 3–5, Nestin-creIKK2flox/flox (IKK2Neu-KO); Lanes 6–8, Nestin-creIKK2flox/+ (control); Lane 9, marker. (BC) Representative Western blot (B) and mean±standarddeviation(SD) IKK2 protein expression in brain, fat, lung, and heart tissues from male control (n=8) and IKK2Neu-KO (n=7) mice at 10–16 wk of age. *p<0.05 vs. control, one-way analysis of variance (ANOVA). (DK) TNFα and IL-6 mRNA expression in hypothalamus, hippocampus, cortex, and olfactory bulb tissues harvested from control and IKK2Neu-KO mice (n=67/group) at 8–12 wk of age following 4 mo of exposure to concentrated ambient particulate matter (PM)2.5 (CAP) or filtered air (FA). *p<0.05 vs. FA, #p<0.05 vs. control, ANOVA.