. 2018 Feb 5;126(2):027003. doi: 10.1289/EHP2311

Figure 3.

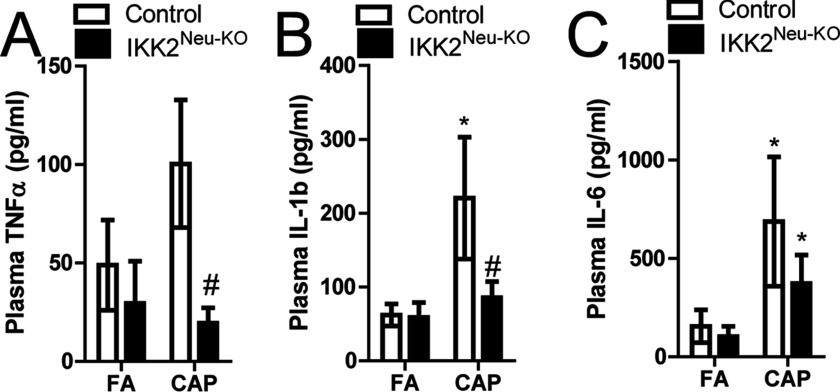
Figures 3A to 3C are stacked bar graphs with standard deviation plotting plasma TNF alpha in picograms per milliliter, plasma IL 1 beta in picograms per milliliter, and plasma IL 6 in picograms per milliliter, respectively (y-axis), from male control mice and IKK2 super Neu KO mice as exposed to CAP and FA (x-axis).

Plasma cytokine levels (BD™ Cytometric Bead Array Kit) following 4 wk of concentrated ambient particulate matter (PM)2.5 (CAP) or filtered air (FA) exposure in male Nestin-creIKK2flox/+ control and Nestin-creIKK2flox/flox (IKK2Neu-KO) mice at 8–12 wk of age (n=67/group). (A) Tumor necrosis factor-α (TNFα), (B) interleukin (IL)-1β, (C) IL-6. *p<0.05 vs. FA, #p<0.05 vs. control, analysis of variance (ANOVA).