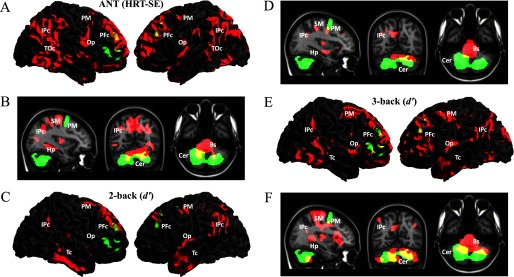
Figure 2.
Regional gray and white matter volumes associated with lifelong residential surrounding greenness and cognitive performance. Results are displayed using conventional canonical templates [Cortex_20484 surface mesh in (A), (C), and (E) and MNI152_T1 template in (B), (D), and (F)] in Montreal Neurological Institute (MNI) space with statistical parametric mapping (SPM8; FIL Methods Group 2013) software. Green areas indicate regional volumes significantly associated with greenness (see Figure 1). Results were considered significant with clusters of (650 voxels) at a height threshold of , which satisfied the family-wise error (FWE) rate correction of . Red areas indicate regional clusters with volumes significantly associated with cognitive functions: hit reaction time standard error (HRT-SE; an indicator of inattentiveness) in (A) and (B); 2-back d′ (an indicator of working memory) in (C) and (D), and 3-back d′ (an indicator of superior working memory) in (E) and (F). The overlaps between regions associated with greenness and those associated with cognitive functions are shown in yellow. Voxels with significant results were binarized to the corresponding single color. (A) Three-dimensional (3D) renderings of cortical gray matter showing clusters negatively associated with HRT-SE in the right and left cortex (left and right panels, respectively). (B) Orthogonal displays (sagittal, coronal, and axial views in the left, middle, and right panels, respectively) showing white matter clusters negatively associated with HRT-SE. (C) 3D renderings of cortical gray matter showing clusters positively associated with 2-back. (D) Orthogonal displays showing white matter clusters positively associated with 2-back. (E) 3D renderings of cortical gray matter showing clusters positively associated with 3-back. (F) Orthogonal displays showing white matter clusters positively associated with 3-back. The right hemisphere appears on the right side of the axial and coronal views. See Table S3 for numeric data for each significant region. Residential greenness exposure was quantified based the average Normalized Difference Vegetation Index (NDVI) within a buffer around all residences since birth, weighted by the time the participant spent at each address. Bs, brainstem; Cer, cerebellum; Hp, hipoccampus; IPc, inferior parietal cortex; Op, operculum; PFc, prefrontal cortex; PM, premotor cortex; SM, sensorimotor cortex; Tc, temporal cortex; TOc, temporo-occipital cortex.

