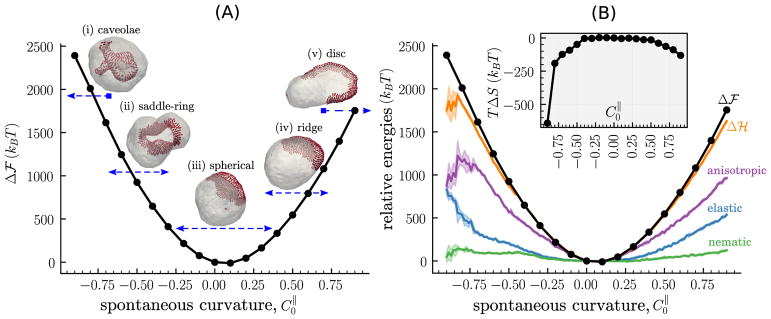
Figure 7.
(A) The relative free energy Δℱ, as a function of the directional spontaneous curvature for a nematic membrane with κ = 10 kBT, κ|| = 5 kBT, and ϕ = 0.25. Images marked (i)–(v) are representative snapshots of the membrane configuration at , −0.6, 0.0, 0.6 and 0.9; the arrows underneath each image represent the range of over which the corresponding configuration is stable. (B) The main panel shows the relative internal energies denoted nematic (equation (7)), elastic (equation (1)), and anisotropic (equation (8)), and their sum is denoted by Δℋ. The entropic contribution to the free energy TΔS is shown in the inset.

