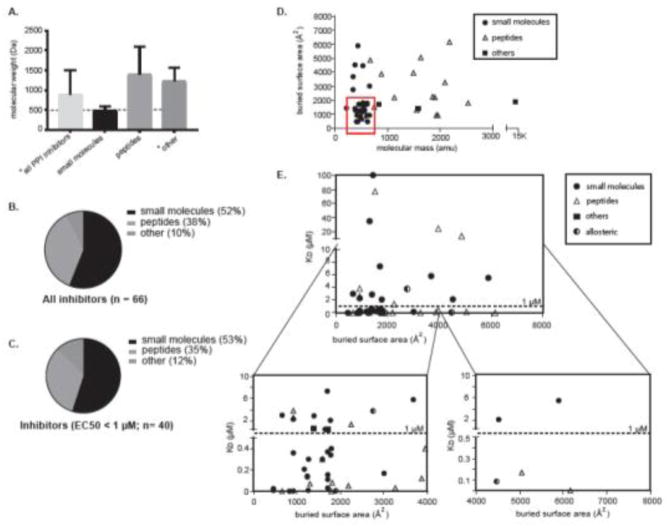
Figure 4.
Relative properties and composition of the technologies used to target PPIs (reported 1/15 to 3/18). (A)The average molecular mass of the three categories of PPI inhibitors. Error bars represent the standard error of the mean (SEM). The dotted line is set to 500 Da. * monobody excluded (B) The relative contriibution of the three inhibitor categories, calculated from the 66 literature examples with reported Kd/Ki value. (B) An analysis of the subset of 40 cases that have reported Kd/Ki values < 1 μM. (D) Distribution of PPI inhibitors based on their molecular weight and BSA of the target interface. The red box signifies the most drug-like inhibitors (e.g. those with the lowest mass and best potency).
(E) Distribution of recent PPI inhibitors (1/15 to 3/18). Each compound was manually designated as either a small molecule, peptide or miscellaneous. In addition, the mechanism-of-action was designated as orthosteric (solid color) or allosteric (split color). For each compound, its potency (Kd or Ki) was plotted against buried surface area (BSA) of the target PPI. The bottom two quadrants (the most potent molecules) are shown as close-ups for clarity.

