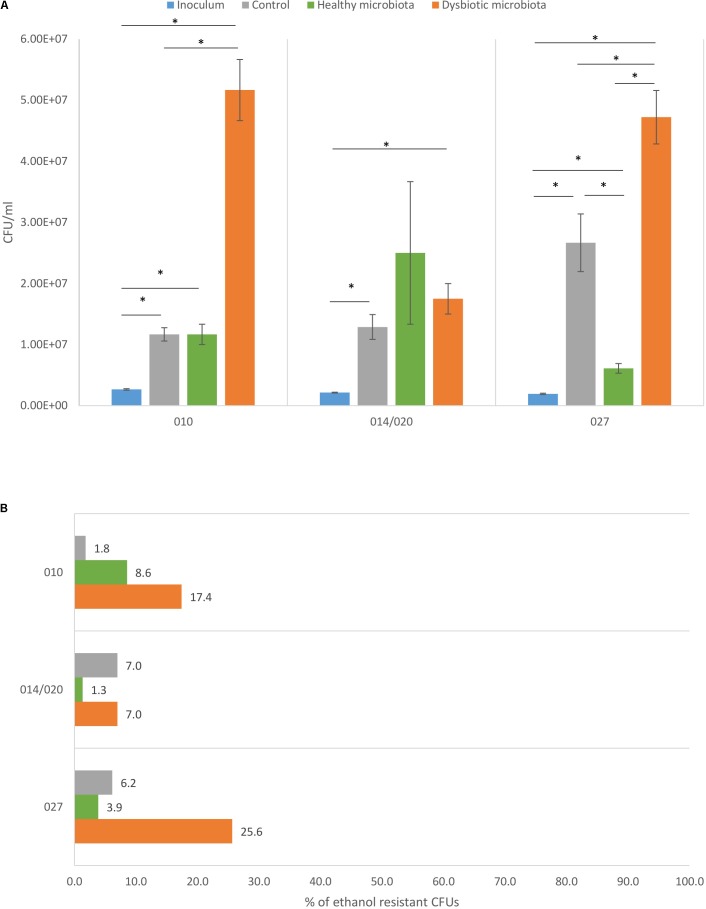
FIGURE 1.
(A) Total viable cell count with corresponding standard deviation for C. difficile ribotypes 010, 014/020, and 027 strains in the inoculum (blue), in the control (gray), in co-culture with healthy fecal microbiota (green) and in co-culture with dysbiotic fecal microbiota (orange). ∗Statistically significant difference. (B) Percentage of C. difficile spores detected as ethanol resistant CFUs in proportion to total CFUs for ribotypes 010, 014/020, and 027 strains in the control (gray), in combination with healthy microbiota (green) and in combination with dysbiotic microbiota (orange).

