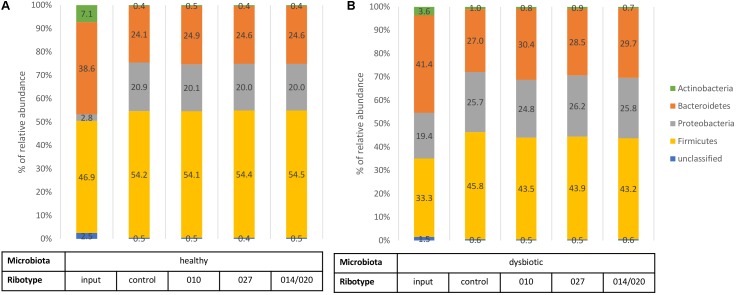
FIGURE 2.
Bacterial phylum level assignments of average relative abundances for fecal input samples (before any cultivation), control samples (fecal microbiota only), and samples of fecal microbiota in combination with C. difficile ribotypes 010, 027, and 014/020 strains. Chart (A) represents samples of healthy fecal microbiota and chart (B) represents samples of dysbiotic fecal microbiota.

