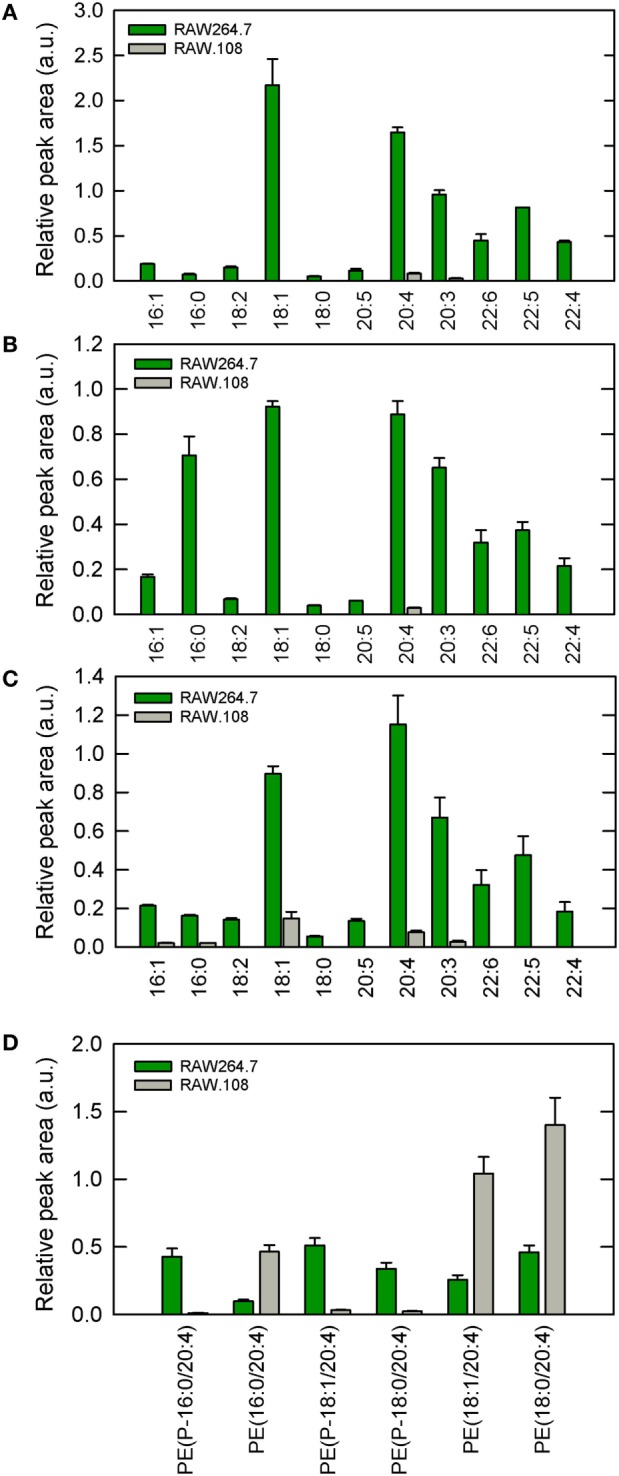
Figure 2.

Ethanolamine plasmalogen content of RAW 264.7 and RAW.108 cells. Analyses were carried out by liquid chromatography coupled to mass spectrometry. The fatty acid distribution within plasmalogen species containing hexadecyl (P-16:0) (A), octadecenyl (P-18:1) (B), or octadecyl (P-18:0) (C) moieties at sn-1 position is shown. Fatty acids (abscissa) are abbreviated as carbon number:double bonds. In (D), the distribution of arachidonic acid (20:4) moieties in ethanolamine phospholipids (including plasmalogen and diacyl species) in RAW 264.7 cells versus RAW.108 cells is shown. Results are given as mean ± SEM of three independent experiments carried out in duplicate.
