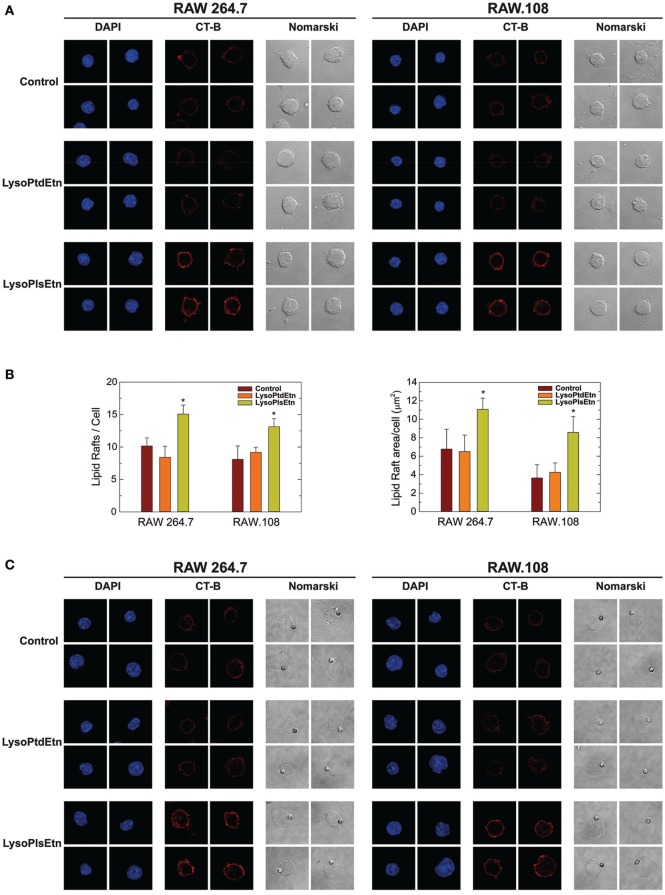
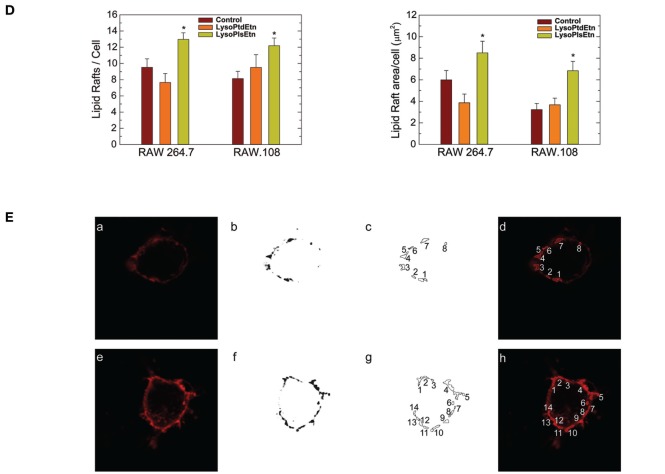
Figure 6.
Effect of lysoPlsEtn on membrane rafts in RAW264.7 and plasmalogen-deficient RAW.108 cells. The cells were either untreated (brown bars) or treated with 10 µM lysoPlsEtn (orange bars) or 10 µM lysoPtdEtn (yellow bars) for 10 min. Then the cells were incubated for 30 min in the absence (A,B) or presence (C,D) of opsonized latex beads (10 particles per cell), stained with fluorescent cholera toxin (CT-B), and analyzed for lipid raft content by confocal microscopy (red color, middle columns). DAPI (1 µg/ml) was used to mark the nuclei (blue; left columns). Nomarski images are also shown (right columns). The average of three independent experiments with 20 determinations each is shown (mean ± SEM) (bottom panel). Original magnification, ×63. *Significantly different (p < 0.05) from untreated cells. (E) Methodology utilized to quantify lipid rafts: (a,e): native images marked with CT-B [(a) control RAW 264.7; (e) RAW 264.7 + lysoPlsEtn]; (b,f) threshold and transform into an 8-bit binary images with MaxEntropy algorithm of ImageJ Threshold tools software; (c,d,g,h) determination and quantification of lipid raft microdomains being equal or greater than 0.1 µm2 [(d,h) lipid raft overlay on native images].


