Figure 7.
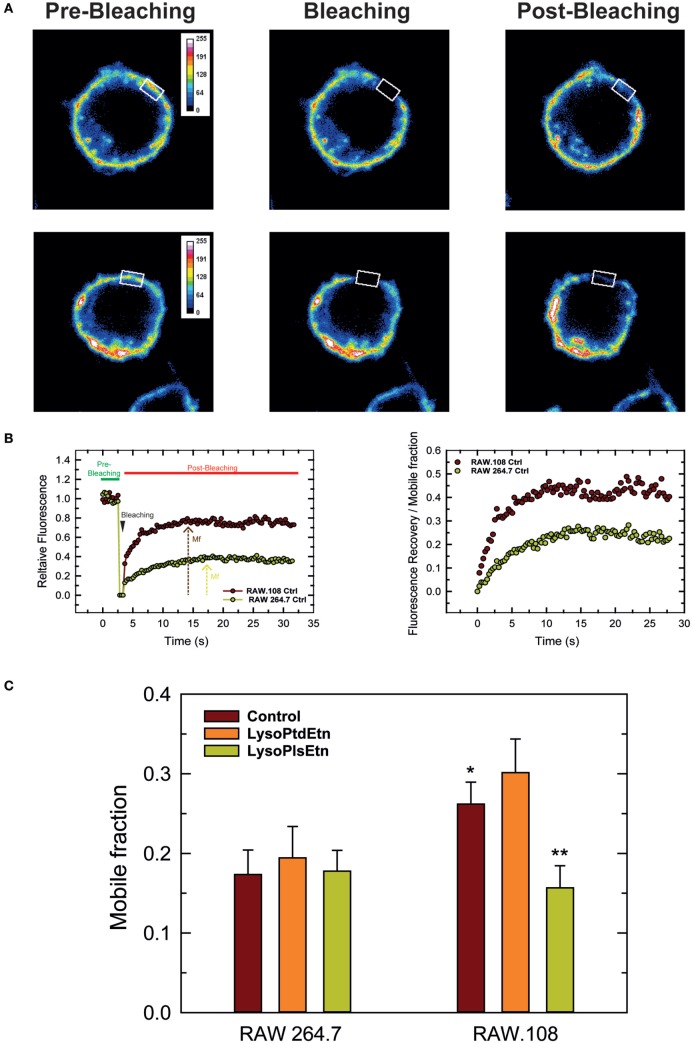
Analysis of membrane fluidity in RAW 264.7 and plasmalogen-deficient RAW.108 cells. The cells were either untreated (brown bars) or treated with 10 µM lysoPlsEtn (orange bars) or 10 µM lysoPtdEtn (yellow bars) for 10 min, were stained with fluorescent cholera toxin (CT-B) for fluorescence recovery after photobleaching (FRAP) in vivo by confocal microscopy. (A) During FRAP image acquisition, a number of images were collected before, during and after photobleaching of a defined region of interest (white square). (B) Left panel, quantification of the mean fluorescence in the regions of interest; an absolute intensity trace showing a typical bleach of 90–100% is illustrated. Right panel, normalized recovery after photobleaching, showing recovery of membrane fluorescence. (C) Comparison of the mobile fraction of membrane fluorescence after bleaching in RAW 264.7 and RAW.108 cells. Data in (C) are the average of three independent experiments of 40 determinations (mean ± SEM). **Significantly different (p < 0.01) with respect to untreated RAW.108 cells. *Significantly different (p < 0.05) with respect to untreated RAW264.7 cells. Original magnification, ×63.

