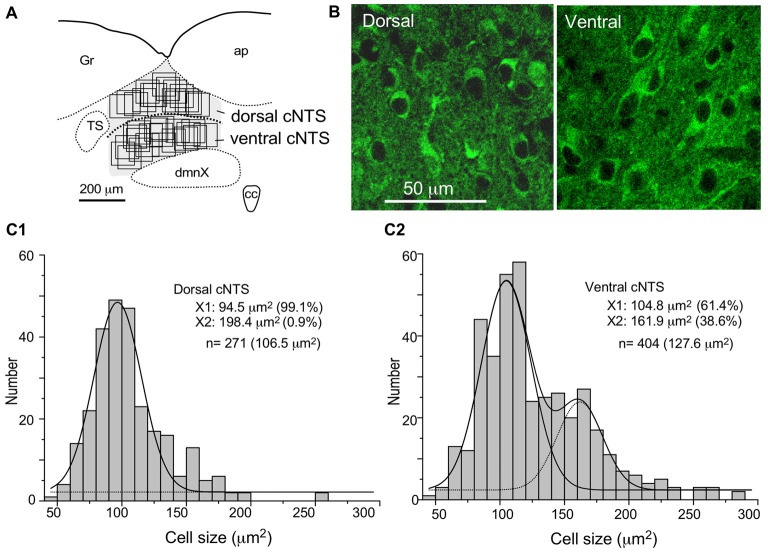
Figure 7.
Stereological quantitation of size distribution of NTS neuronal soma according to subregion. Disectors of a 100 μm × 100 μm frame (A,B) were applied to NSE-positive cell soma (B) in dorsal and ventral subregions of the cNTS at the level of the AP (A). Cell body numbers and sizes were counted and measured, and the size distributions in each subregion were fitted by two Gaussian curves (C1,2). The numerical densities are shown in Table 2.

