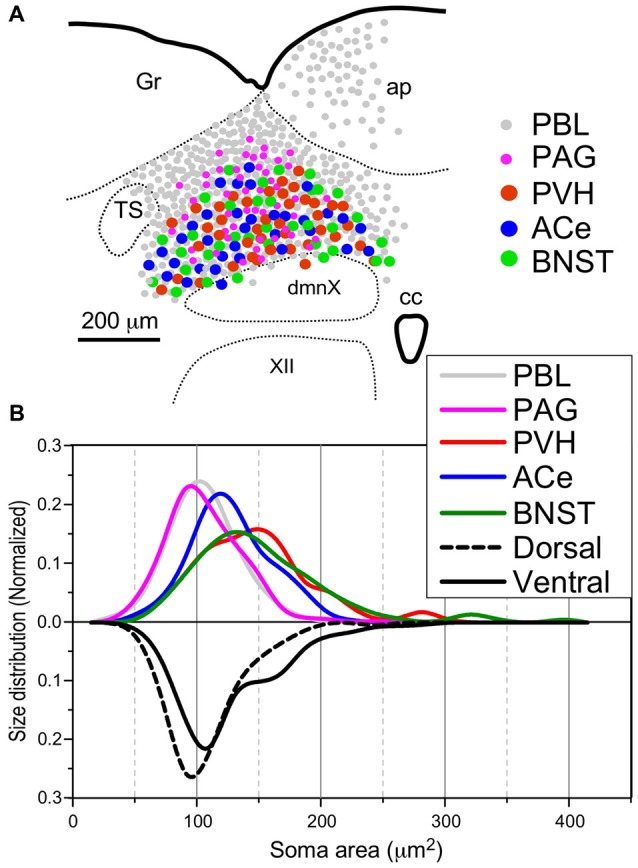
Figure 8.

Site (A) and size (B) distributions of target-specific projections of the cNTS neurons. (A) Subnuclear localization of target-specific projection neurons. PBL-targeting projection cells were distributed evenly in the cNTS (gray small circle), while other projection neurons were noted to be localized more specifically in the ventral cNTS. A smaller population of small-sized PAG-targeting cells is also noted in the dorsal cNTS (magenta small circle). Each projection cell is indicated by colored and sized (small or large) solid circles. The cell diameter, number of cell profiles per tissue section, and relative proportion of cell profiles in the ventral cNTS of each projection neuron are shown in Table 2. (B) Normalized size distribution of the target-specific projection neurons (colored lines, upper) and region-specific cNTS cells (dotted or lined lines, lower). Note the projection-specific difference in intranuclear location and cell-body size between the cNTS neurons. Also note the similarity in morphological features between PVH- and BNST-projecting neurons.
