Figure 6.
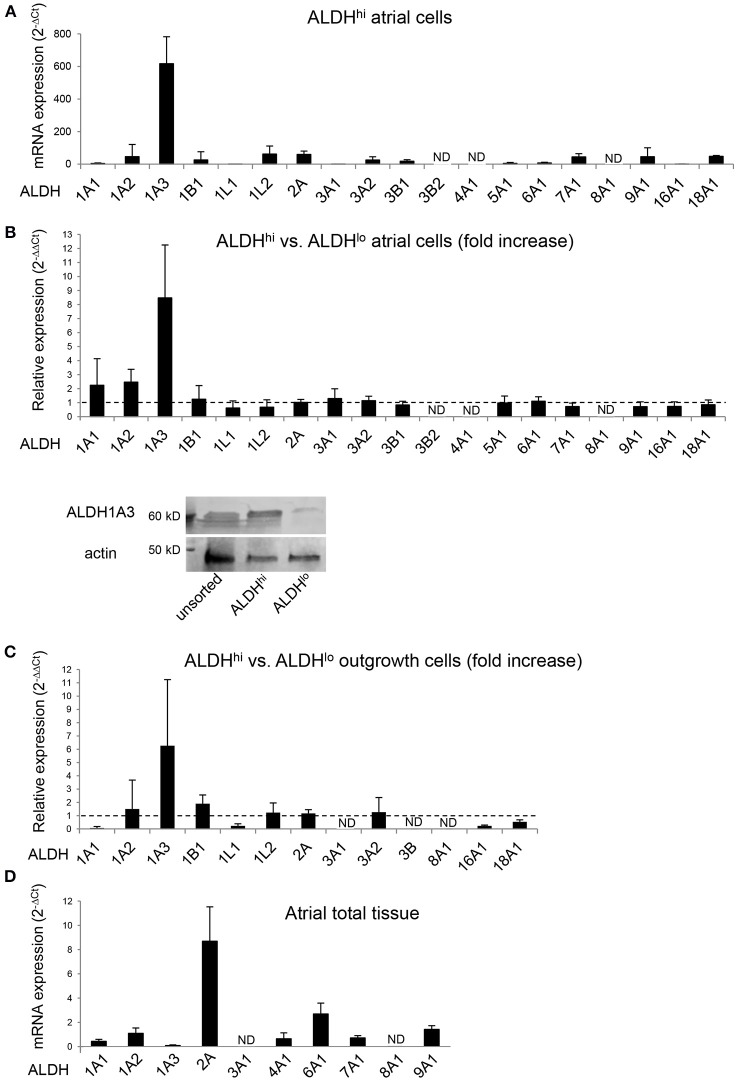
RT-PCR analysis of ALDH isoform gene expression in different populations. (A) ALDHhi cells isolated using enzymatic techniques. Upper panel: ALDH isoform expression (2−ΔCt values; n = 4 patients). Lower panel: Relative expression in ALDHhi vs. ALDHlo cells (2−ΔΔCt values; n = 4). (B) Western blot showing ALDH1A3 protein expression in unsorted, ALDHhi and ALDHlo atrial cells. (C) Outgrowth cells. Relative expression in ALDHhi vs. ALDHlo cells is shown (n = 3). (D) Total atrial tissue (2−ΔCt values; n = 3). ND, not determined (2−ΔΔCt values that could not be calculated).

