Figure 7.
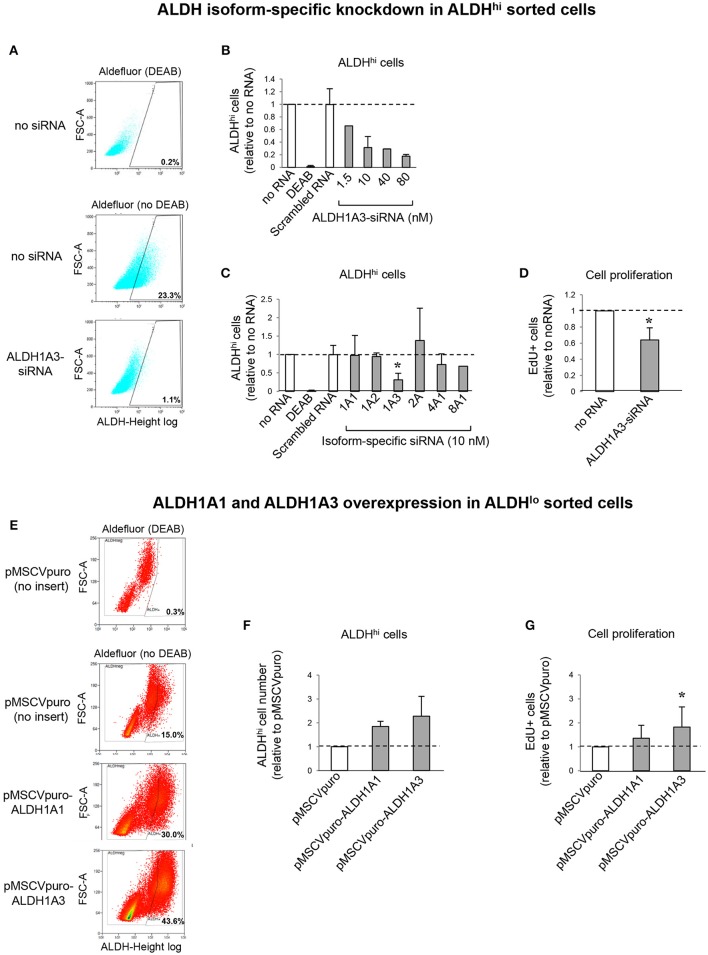
ALDH isoform-specific loss- and gain-of-function studies. (A) Flow cytometry plots of ALDHhi sorted, Aldefluor-reacted cells (with or w/o DEAB) after siALDH1A3 transfection or mock transfection (no siRNA). (B) siALDH1A3 dose-response study. ALDHhi cell numbers after siALDH1A3 transfection using the indicated concentrations relative no siRNA. (C) ALDHhi cell numbers after siALDH-isoform-specific transfection (10 nM) relative to no siRNA). (D) EdU+ cell numbers (%) after siALDH1A3 transfection (10 nM) relative no siRNA. (E) Flow cytometry plots of ALDHlo sorted, Aldefluor-reacted cells (with or w/o DEAB) transduced with pMSCVpuro-ALDH1A1 or pMSCVpuro-ALDH1A3 retroviral vectors, or control vector with no insert (pMSCVpuro). (F) ALDHhi cell numbers after transduction with pMSCVpuro-ALDH1A1 or pMSCVpuro-ALDH1A3 relative to control vector. (G) EdU+ cell numbers (%) after transduction with pMSCVpuro-ALDH1A1 or pMSCVpuro-ALDH1A3 relative to control vector; *p < 0.05.

