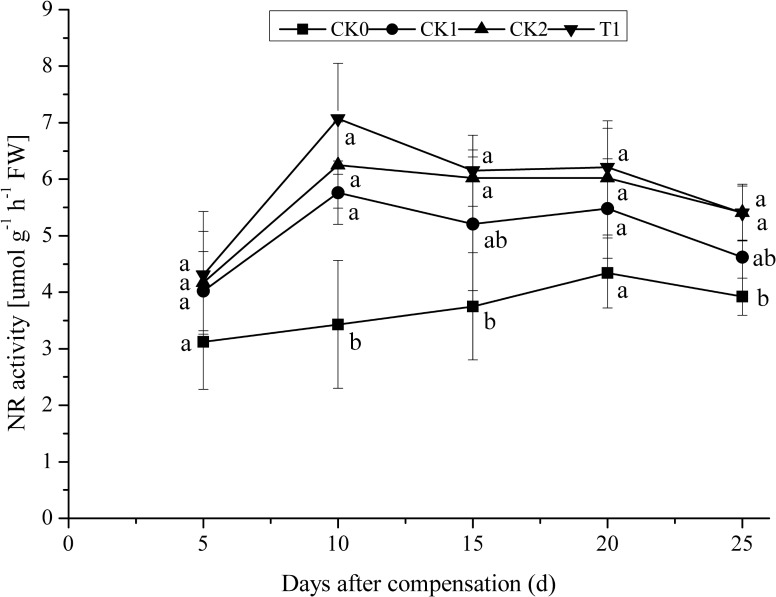
FIGURE 2.
Dynamics of NR activity under the treatment of nitrogen deficiency and compensation in double-cropping super hybrid late rice during the year 2015; The column data in figure is average and the short lines represents the mean square deviation, values in the same column show means via the Tukey’s multiple range test, and different letters indicate that the means were statistically different (P < 0.05), n = 3.

