
Figure 1.
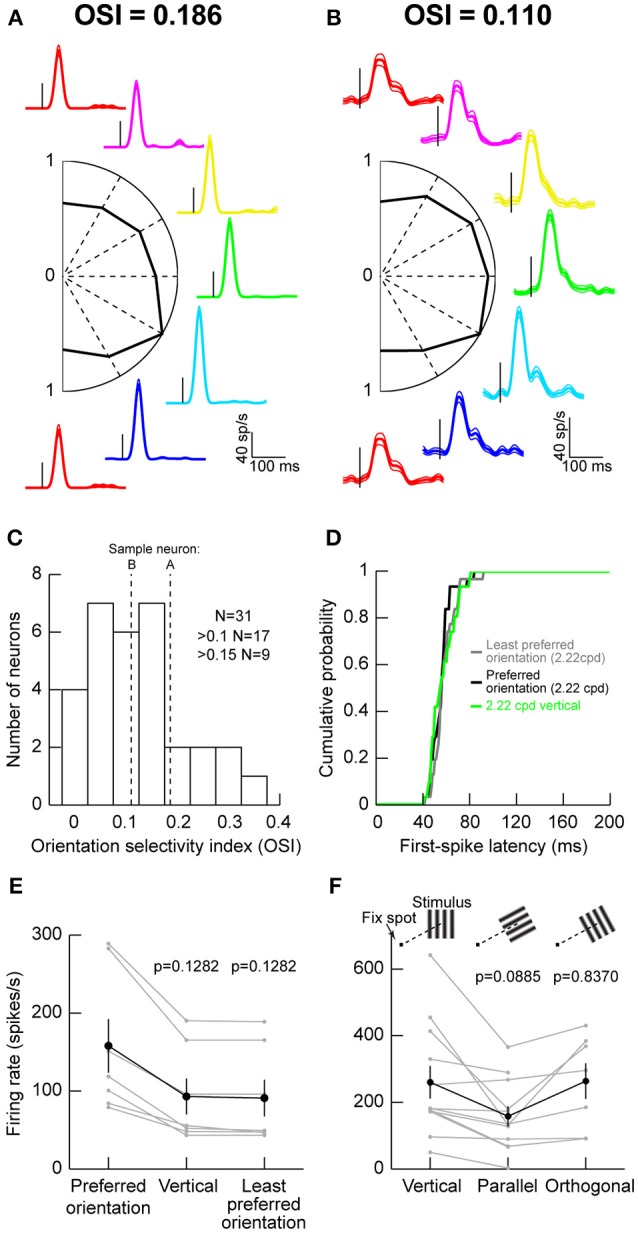
Orientation tuning in the macaque superior colliculus (SC). (A) Visual responses of an example SC neuron to gratings of different orientations (color-coded) presented within the neuron's visual response field (RF). The firing rate curves are graphically arranged according to the grating orientation. For example, the red curves are for vertical gratings, and the green curve is for horizontal gratings. Each curve is aligned on stimulus onset (small vertical black line in each firing rate curve), and the data for each orientation show the mean firing rate across trials, accompanied by s.e.m. curves as thin lines. The scale bars in the bottom right apply to all shown firing rate curves. In the center of the panel, we plotted the peak visual response (normalized to the maximum at one of the orientations) as a function of grating orientation. This neuron preferred an orientation of 30° below horizontal (cyan firing rate curve). The orientation selectivity index (OSI; Materials and Methods) of this neuron is indicated above the data. (B) A second neuron with weaker orientation selectivity. The neuron responded almost equally well to all orientations. (C) Distribution of OSI values across our population. The majority of neurons had mild orientation selectivity. (D) Consistent with this, first-spike latency did not depend strongly on stimulus orientation. The figure shows the distribution of first-spike latencies for the least preferred orientation, the most preferred orientation, or a vertical grating like that we used in Chen et al. (2015). In all cases, first-spike latency was similar (p = 0.5884, Kruskal-Wallis test). (E) Also, for neurons not preferring vertical orientations, the differences in visual responses between the most preferred, the least preferred, and the vertical orientations were mild. The black curve shows the summary across neurons, and the gray curves show responses for individual neurons. The p-values indicate the results of a Wilcoxon rank sum test comparing a given orientation (e.g., vertical or least preferred) to the preferred orientation of a given neuron. (F) Testing parallel vs. orthogonal orientations relative to the line connecting the fovea to the RF stimulus location (see schematics above the data points showing a fixation spot and a grating of a given orientation). Parallel gratings (oriented parallel to the line connecting the fovea to the neuron's RF hotspot) had weaker responses than orthogonal ones (oriented orthogonal to the line connecting the fovea to the neuron's RF hotspot). Error bars in all panels denote s.e.m.