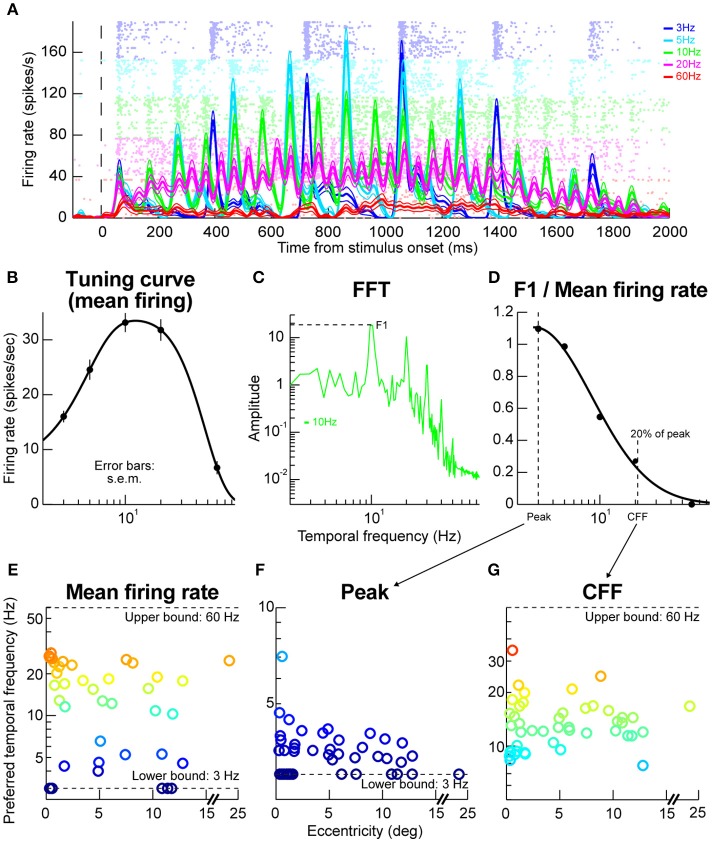
Figure 5.
Temporal frequency tuning by macaque SC. (A) Example firing rates and raster plots from a neuron exposed to flicker of different frequencies. At low frequencies, the neuron emitted phasic responses to individual stimulus events (e.g., at 3 Hz; blue curves and rasters). At higher frequencies, the individual phasic events started to merge or fuse (e.g., at 20 Hz; magenta curves and rasters). At even higher frequencies (e.g., 60 Hz; red curves and rasters), the neuron stopped responding completely even though the stimulus was practically almost permanently on the display. The formatting of this panel is similar to that described for Figures 2A,B above (i.e., for the faint dots describing action potentials and firing rate curves describing averages and s.e.m. boundaries), and error bars denote s.e.m. (B) The tuning curve of the neuron obtained by plotting mean firing rate as a function of temporal frequency. The neuron responded best for 10–20 Hz frequencies. (C) Fourier transform of firing rate for the same neuron with 10 Hz stimulus flicker. The neuron had a dominant harmonic at 10 Hz (F1) along with power at different frequencies (e.g., multiples of 10 Hz), including also DC (0 Hz), indicating a non-zero average response (sometimes referred to as F0). (D) We plotted the power at F1 divided by the mean response for this condition (or the DC response), to estimate how big the phasic response to individual stimulus events was relative to the overall average. For this same neuron, the phasic response at 3 Hz was very strong (also evident in A). At near 20 Hz, the individual phasic responses (aligned to stimulus flicker) were much weaker compared to the overall average firing rate, suggesting “flicker fusion.” We defined the critical flicker fusion frequency as the frequency for which F1/F0 was 20% of the peak. (E) Preferred temporal flicker frequencies of all neurons based on tuning curves like in (B), and plotted as a function of each neuron's preferred retinotopic eccentricity. There was no apparent eccentricity dependence of temporal tuning. (F,G) the parameters of the curve in (D) across all our neurons. Most neurons had a critical flicker fusion frequency near 20 Hz. Error bars in all panels indicate s.e.m. Also, the colors in (E–G) are provided as a visual aid, and they go from cool to warm with increasing y-axis values.

