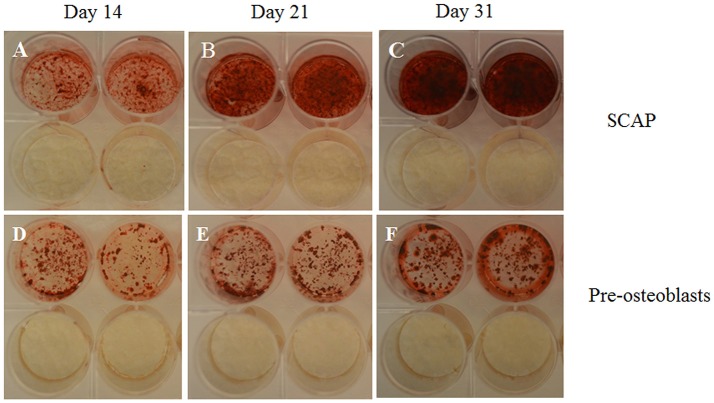
Figure 4.
Photographs of wells; taken from 24 well plates showing the more intense Alizarin Red S stain uptake by SCAP (A–C) vs. preosteoblasts (D–F) along 3 time intervals; 14 days (A,D), 21 days (B,E), and 31 days (C,F). Note the lack of stain uptake in the non-induced wells in both cell types. Osteogenic differentiation protocols used were in accordance to Sonoyama et al. (2008).

