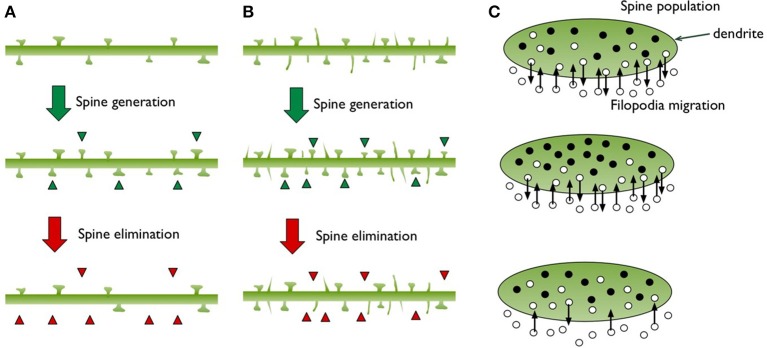
Figure 2.
This diagram illustrates the structural changes observed on a dendritic branch during spine generation and elimination. (A) Only mushroom shaped spines are depicted, green triangles point to the new spines and red triangles point to the ones that have disappeared. (B) Filopodia protrusions are included, which make up roughly 50% of the total population. We illustrate how filopodia can increase the chance of meeting more axons and producing more synapses. (C) Based on the spine and filopodia populations in (B), we illustrate the dendrite as a well-defined territory and show spines (filled black circles) as a group residing inside. Filopodia are shown as migrating individuals that go in and out of the territory (small open circles).

