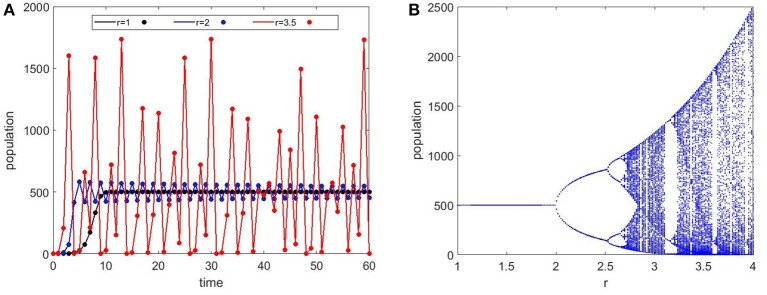
Figure 3.
Ricker maps for Equation (1). (A) Time series evolution of the Ricker population equation for different values of r (small growth rate). The carrying capacity is set constant at 500 for all cases. The black curve with r = 1 shows an initial exponential increase that stabilizes at the carrying capacity. At r = 2, the population oscillates between two values but stays stable. At r = 3.5, we see chaotic oscillations in the population that shows dramatically high numbers as well as extinction. (B) The bifurcation map which shows the population as r is varied. The period doubling bifurcations lead to chaotic dynamics at about r = 2.7.

