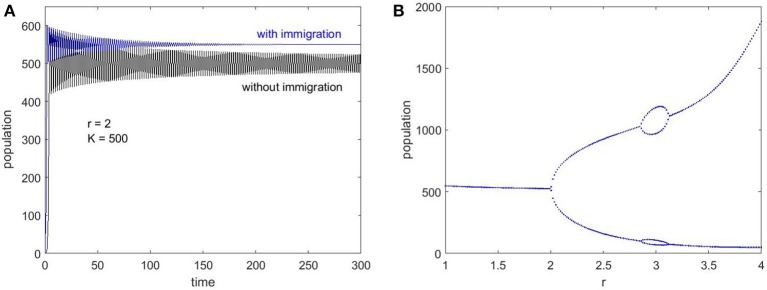
Figure 4.
Ricker maps to illustrate the effect of immigration. (A) Time series evolution for f = 0 (no immigration) and f = 100 (with immigration), which demonstrates the stabilization after a return time when there is non-zero immigration. (B) Bifurcation map with f = 50 shows the absence of chaos, even though there are bifurcations into 2 and 4 point limit cycles as r increases.

