
Figure 6.
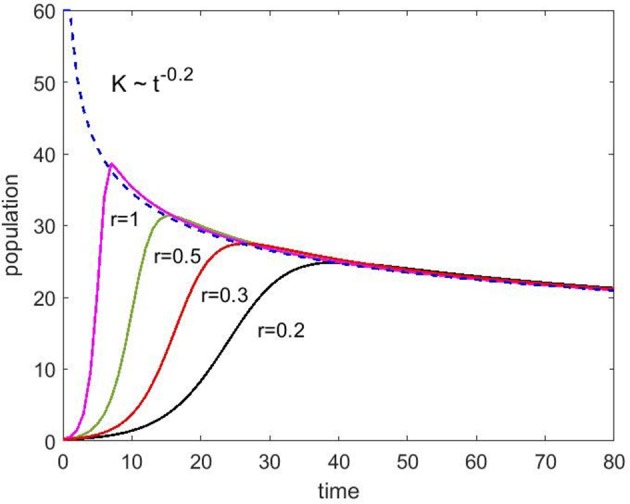
Population change as a function of time without immigration (Equation 4) for various growth rates (r) ranging from 0.2 to 1 as indicated. The carrying capacity starts at 60 and decays with the exponent 0.2.
Official websites use .gov
A
.gov website belongs to an official
government organization in the United States.
Secure .gov websites use HTTPS
A lock (
) or https:// means you've safely
connected to the .gov website. Share sensitive
information only on official, secure websites.
Population change as a function of time without immigration (Equation 4) for various growth rates (r) ranging from 0.2 to 1 as indicated. The carrying capacity starts at 60 and decays with the exponent 0.2.