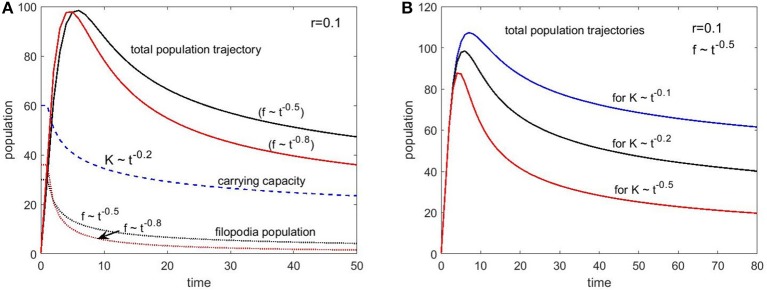
Figure 7.
Population change as a function of time with immigration (filopodia) (Equation 5) for different set of parameters. (A) The carrying capacity decay is set with 0.2 exponent and two different filopodia population decay conditions are simulated with the exponents 0.5 and 0.8. (B) The filopodia decay is kept constant (exponent is 0.5) and three different carrying capacity decay exponents are simulated (0.1, 0.2, and 0.5). The growth rate was the same (r = 0.1) for all conditions.

