
Figure 8.
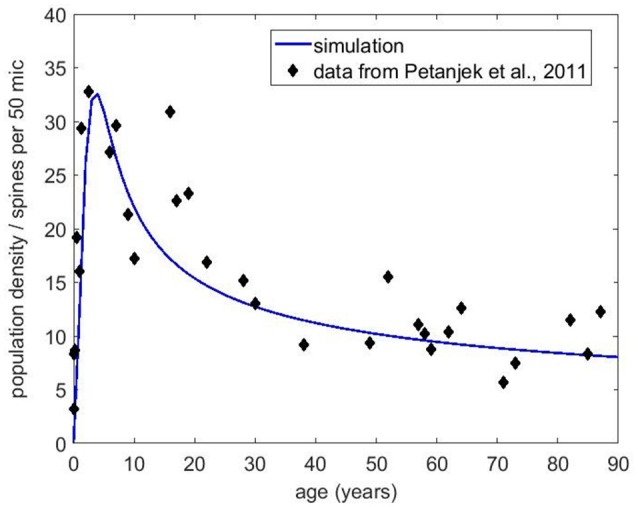
Spine density data obtained from Petanjek et al. (2011) for the basal dendrites in layer III. The blue curve is the simulation results using Equation (5) with r = 0.2, initial carrying capacity of 25 and the exponents a = 0.3 and b = 0.8 for the carrying capacity and the filopodia decay. Initial filopodia population was set at 50% of the carrying capacity.