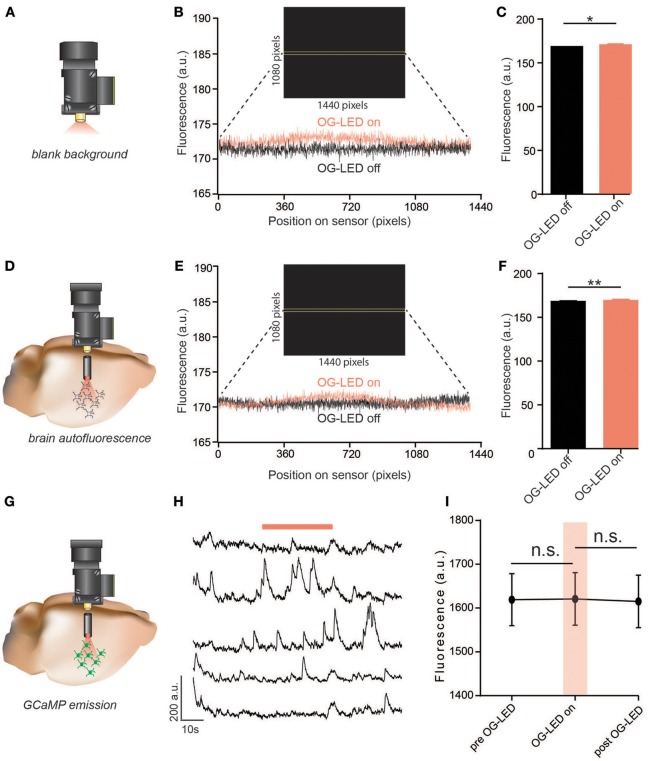
Figure 2.
Exposure to OG-LED results in minimal fluorescence emission from microscope, lens, brain tissue, or GCaMP. (A) Schematic of ex-vivo OG-LED optical crosstalk measurements. The microscope was aimed into a black box in a dark room and fluorescence was measured during snapshots of OG-LED off (0 mW/mm2) and OG-LED on (10 mW/mm2) periods (50 ms exposure). This was repeated 4 times with 4 different microscopes. (B) Example fluorescent counts measured across the sensor through the equators of the obtained images, (OG-LED off and OG-LED on) averaged over 32 rows of pixels (46,080 total pixels). Inset: example frame captured during an OG-LED on snapshot, with yellow bars highlighting where the counts were averaged across the sensor. (C) OG-LED increased the average fluorescence detected by the sensor 2.06 ± 0.43 counts (n = 4 microscopes, paired t-test, p < 0.01). (D) Schematic of in-vivo measurements of OG-LED-induced emission of brain tissue autofluorescence. The integrated microscope was interfaced with a GRIN lens and changes in fluorescence were measured during snapshots of OG-LED off (0 mW/mm2) and OG-LED on (10 mW/mm2) periods from a mouse that is not expressing any foreign fluorescent protein. (E) Example fluorescent counts measured across the sensor through the equators of the obtained images, (OG-LED off and OG-LED on) averaged over 32 rows of pixels (46,080 total pixels). Inset: example frame captured during an OG-LED on snapshot, with yellow bars highlighting where the counts were averaged across the sensor. (F) OG-LED increased the average fluorescence detected by the sensor 2.54 ± 0.14 counts (n = 6 recordings from n = 2 mice, paired t-test, p < 0.01). (G) Schematic of in-vivo measurements of changes in GCaMP emission during exposure to OG-LED light (10 mW/mm2). Experiments were conducted by interfacing the integrated microscope with a GRIN lens measuring fluorescence changes in GCaMP expressing neurons in a mouse brain. (H) Representative Ca2+ traces of individual neurons. Orange bar represents OG-LED on period. (I) OG-LED off, OG-LED on, OG-LED off: before, during, after an OG-LED light pulse (30 s each, average of 3 trials). The average fluorescent counts did not significantly change during the 30 s OG-LED pulse (n = 40 cells from n = 2 mice, repeated-measures one-way ANOVA followed by Bonferroni multiple pairwise comparisons, pre vs. on, p = 0.99; post vs. on, p = 0.09). All error bars are SEM. *p < 0.05; **p < 0.01.

