
Figure 6.
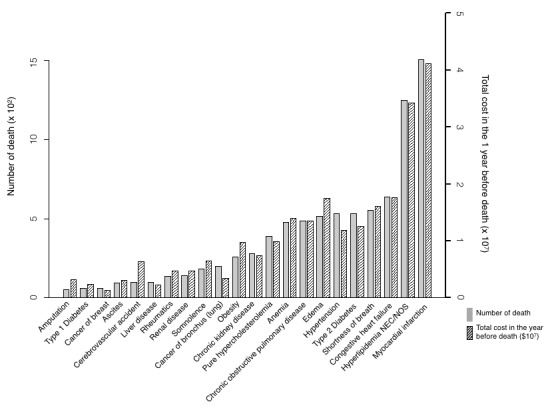
Prospective analysis of total cost in the year of death and the number of deaths by the top 22 mortality rate commodities in high-risk mortality patients.
Official websites use .gov
A
.gov website belongs to an official
government organization in the United States.
Secure .gov websites use HTTPS
A lock (
) or https:// means you've safely
connected to the .gov website. Share sensitive
information only on official, secure websites.
Prospective analysis of total cost in the year of death and the number of deaths by the top 22 mortality rate commodities in high-risk mortality patients.