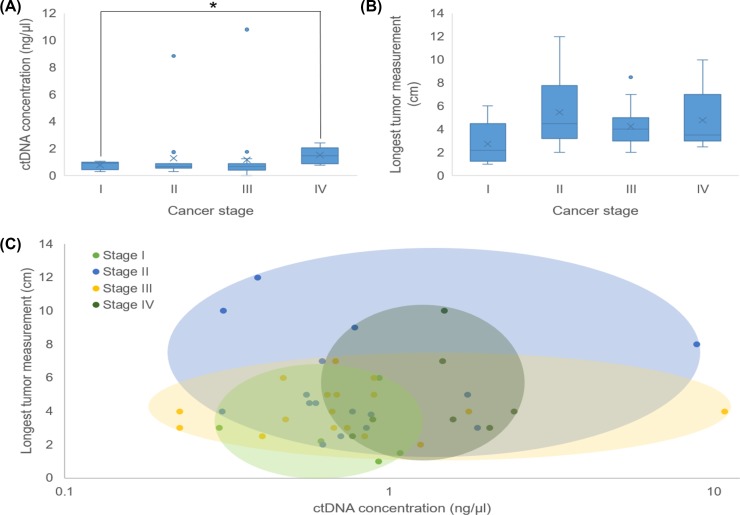
Figure 2. Comparison of ctDNA concentration, tumor size, and cancer stage.
(A) Box and whisker plot of patients’ ctDNA concentration compared with cancer stages. The ctDNA concentration in patients with Stage I cancer was significantly less than that in patients with Stage IV cancer (P = 0.0149). (B) Box and whisker plot of each patient’s LTM (cm) compared with cancer size. (C) Colored ovals represent the range of ctDNA concentration compared with LTM for each patient based on cancer stage.

