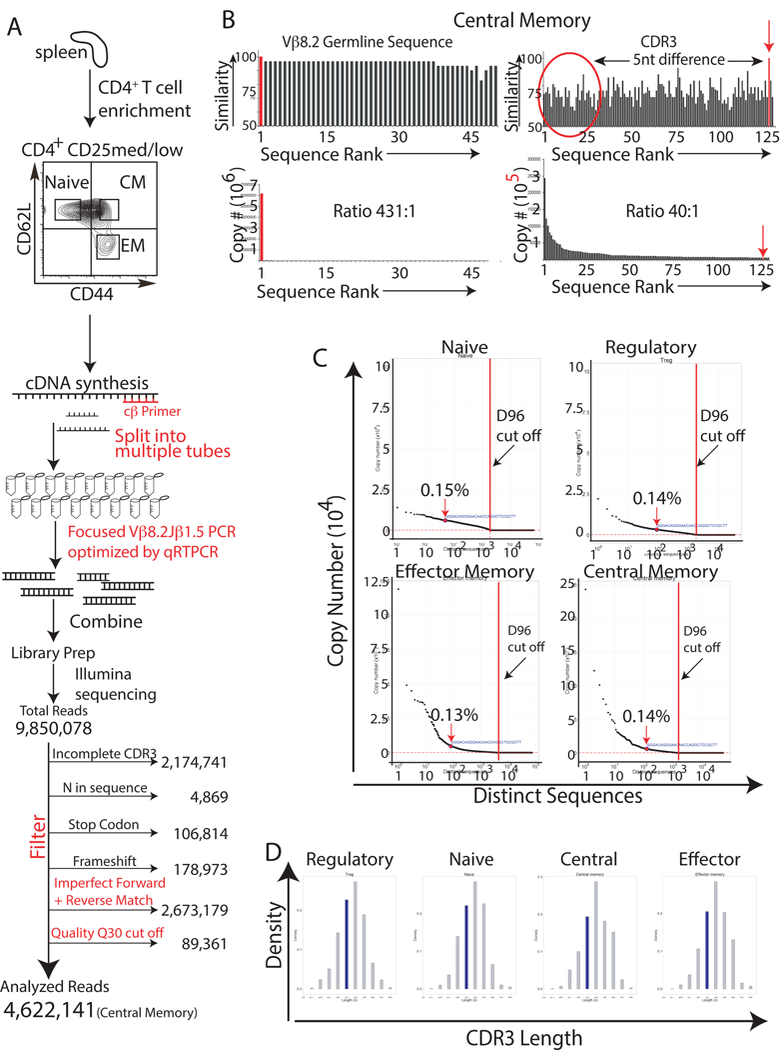
Fig. 2. In unimmunized animals HEL-specific T cells are present in the naive, regulatory, effector memory, and central memory T cell compartments.

(A) Splenocytes from antigen-naive, 12-to-14-week-old BALB/c mice were FACS sorted to isolate naive, regulatory, effector memory, and central memory T cells using antibodies specific to CD4, CD25, CD127, CD44, and CD62L. RNA was then harvested from the isolated T cells and cDNA was synthesized using a TCR-specific primer to the constant region of the TCR β gene. To minimize amplification bias, the cDNA was then split into multiple PCR reaction tubes. Primers to Vβ8.2 and Jβ1.5 and high high-fidelity Taq DNA polymerase were then used to amplify the CDR3 region of just the Vβ8.2Jβ1.5 subpopulation of T cells. To minimize amplification bias, the number of PCR cyles was optimized by real-time PCR to ensure that PCR reactions were stopped during the linear phase of the amplification. Amplified products were used to generate sequencing libraries. 9,850,078 total reads were obtained from the central memory T cell library. These sequences were then filtered to remove sequences with incomplete CDR3 regions, N’s, and frameshifts. Sequences were also removed if they did not meet a Phred quality score cut-off of 30, or if their forward and reverse sequences did not match perfectly. The remaining 4,622,141 (central memory) CDR3 sequences were then analyzed to determine the frequency of the HEL-specific sequence. The same process was repeated for the other T cell subpopulations. Results are representative of three independent experiments. (B) The germline Vβ8.2 sequence, upstream of the CDR3 region, was used to determine the frequency of sequencing/amplification errors. Similarity scores for the different reads, and the read’s copy number are represented graphically against sequence rank order; the reads were ranked based upon their copy number with “1” being the most abundant read. Results are representative of three independent experiments. (C) Graphs of copy number vs. distinct CDR3 sequence revealed that the HEL- specific Vβ8.2Jβ1.5 CDR3 sequence was present within the naive, regulatory, effector memory, and central memory T cell populations and that the sequence was not expanded when compared with other CDR3 sequences. D96 cut off values(red dot lines) were calculated [5] to identify CDR3 sequences that resided at unacceptably low frequencies, i.e. those that had an increased possibility of originating from amplification or sequencing errors. Results are representative of three independent experiments. (D) In silico spectratyping of CDR3 lengths revealed Gaussian distributions for the naive, regulatory, central memory, and effector memory Vβ8.2Jβ1.5 spectra. Results are representative of at lest three independent experiments.
