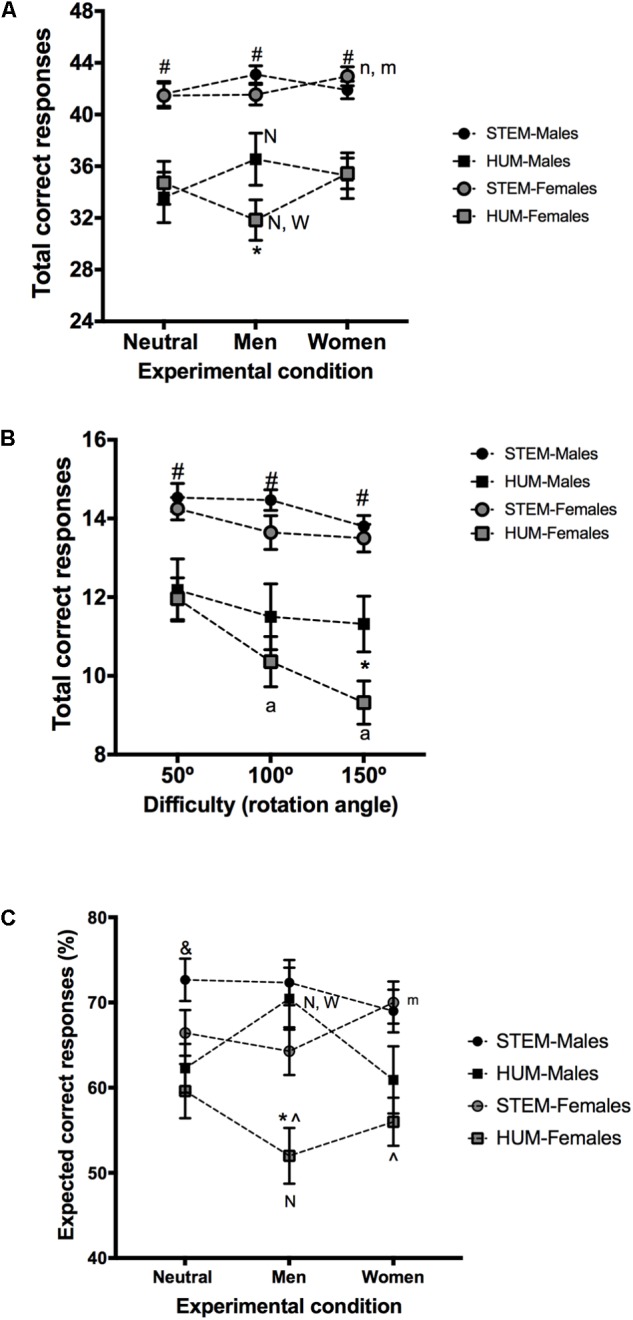
FIGURE 2.

3DMRT observed and expected performance. (A) Depicts the observed performance (mean ± SEM of the number of correct responses) in a mental rotation task run under three experimental conditions (“neutral,” “optimized for men” and “optimized for women”). (B) Illustrates the relationship between task difficulty (rotation angle) and 3DMRT observed performance (mean ± SEM of correct responses) for each participant’s group for the “optimized for men” condition. (C) Shows expected performance (mean ± SEM of the participants’ expected percentage of correct responses) as a measure of task execution confidence in each experimental phase (see the Measures section for details). Note that in (A,B), the Y-axis were adjusted to denote optimal and chance levels performance [#Significantly different from HUM groups; ∧Significantly different from STEM groups; ∗Significantly different from HUM-Males; &Significantly different from HUM-Females; N, n Significantly different from the “neutral” condition (p < 0.01 and p < 0.05, respectively); W Significantly different from the “optimized for women condition” (p < 0.01); m Significantly different from the “optimized for men” condition (p < 0.05); a Significantly different from the 50o rotation angle (p < 0.05)].
